Sallie Mae 2011 Annual Report Download - page 95
Download and view the complete annual report
Please find page 95 of the 2011 Sallie Mae annual report below. You can navigate through the pages in the report by either clicking on the pages listed below, or by using the keyword search tool below to find specific information within the annual report.-
 1
1 -
2
-
3
-
4
-
5
-
6
-
7
-
8
-
9
-
10
-
11
-
12
-
13
-
14
-
15
-
16
-
17
-
18
-
19
-
20
-
21
-
22
-
23
-
24
-
25
-
26
-
27
-
28
-
29
-
30
-
31
-
32
-
33
-
34
-
35
-
36
-
37
-
38
-
39
-
40
-
41
-
42
-
43
-
44
-
45
-
46
-
47
-
48
-
49
-
50
-
51
-
52
-
53
-
54
-
55
-
56
-
57
-
58
-
59
-
60
-
61
-
62
-
63
-
64
-
65
-
66
-
67
-
68
-
69
-
70
-
71
-
72
-
73
-
74
-
75
-
76
-
77
-
78
-
79
-
80
-
81
-
82
-
83
-
84
-
 85
85 -
 86
86 -
 87
87 -
 88
88 -
 89
89 -
 90
90 -
 91
91 -
 92
92 -
 93
93 -
 94
94 -
 95
95 -
 96
96 -
 97
97 -
 98
98 -
 99
99 -
 100
100 -
 101
101 -
 102
102 -
 103
103 -
 104
104 -
 105
105 -
106
-
107
-
108
-
109
-
110
-
111
-
112
-
113
-
114
-
115
-
116
-
117
-
118
-
119
-
120
-
121
-
122
-
123
-
124
-
125
-
126
-
127
-
128
-
129
-
130
-
131
-
132
-
133
-
134
-
135
-
136
-
137
-
138
-
139
-
140
-
141
-
142
-
143
-
144
-
145
-
146
-
147
-
148
-
149
-
150
-
151
-
152
-
153
-
154
-
155
-
156
-
157
-
158
-
159
-
160
-
161
-
162
-
163
-
164
-
165
-
166
-
167
-
168
-
169
-
170
-
171
-
172
-
173
-
174
-
175
-
176
-
177
-
178
-
179
-
180
-
181
-
182
-
183
-
184
-
185
-
186
-
187
-
188
-
189
-
190
-
191
-
192
-
193
-
194
-
195
-
196
-
197
-
198
-
199
-
200
-
201
-
202
-
203
-
204
-
205
-
206
-
207
-
208
-
209
-
210
-
211
 |
 |

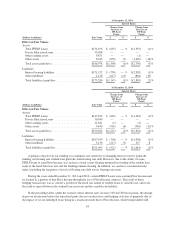
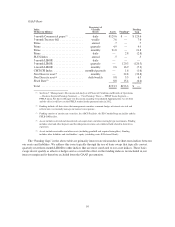
At December 31, 2011
Interest Rates:
Change from
Increase of
100 Basis
Points
Change from
Increase of
300 Basis
Points
(Dollars in millions) Fair Value $ % $ %
Effect on Fair Values
Assets
Total FFELP Loans ............................ $134,196 $ (665) — % $(1,335) (1)%
Private Education Loans ........................ 33,968 — — — —
Other earning assets ............................ 9,871 — — (1) —
Other assets .................................. 8,943 (639) (7) (1,420) (16)%
Total assets gain/(loss) .......................... $186,978 $(1,304) (1)% $(2,756) (1)%
Liabilities
Interest bearing liabilities ....................... $171,152 $ (730) — % $(2,002) (1)%
Other liabilities ............................... 4,128 (617) (15) (801) (19)
Total liabilities (gain)/loss ....................... $175,280 $(1,347) (1)% $(2,803) (2)%
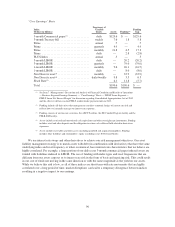
At December 31, 2010
Interest Rates:
Change from
Increase of
100 Basis
Points
Change from
Increase of
300 Basis
Points
(Dollars in millions) Fair Value $ % $ %
Effect on Fair Values
Assets
Total FFELP Loans ............................ $147,163 $ (649) — % $(1,318) (1)%
Private Education Loans ........................ 30,949 — — — —
Other earning assets ............................ 11,641 (1) — (2) —
Other assets .................................. 9,449 (565) (6) (996) (11)%
Total assets gain/(loss) .......................... $199,202 $(1,215) (1)% $(2,316) (1)%
Liabilities
Interest bearing liabilities ....................... $187,959 $ (704) — % $(1,938) (1)%
Other liabilities ............................... 3,136 (217) (7) 257 8
Total liabilities (gain)/loss ....................... $191,095 $ (921) — % $(1,681) (1)%
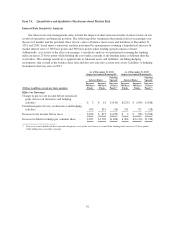
A primary objective in our funding is to minimize our sensitivity to changing interest rates by generally
funding our floating rate student loan portfolio with floating rate debt. However, due to the ability of some
FFELP loans to earn Floor Income, we can have a fixed versus floating mismatch in funding if the student loan
earns at the fixed borrower rate and the funding remains floating. In addition, we can have a mismatch in the
index (including the frequency of reset) of floating rate debt versus floating rate assets.
During the years ended December 31, 2011 and 2010, certain FFELP Loans were earning Floor Income and
we locked in a portion of that Floor Income through the use of Floor Income contracts. The result of these
hedging transactions was to convert a portion of the fixed rate nature of student loans to variable rate, and to fix
the relative spread between the student loan asset rate and the variable rate liability.
In the preceding tables, under the scenario where interest rates increase 100 and 300 basis points, the change
in pre-tax net income before the unrealized gains (losses) on derivative and hedging activities is primarily due to
the impact of (i) our unhedged loans being in a fixed-rate mode due to Floor Income, while being funded with
93