Sallie Mae 2009 Annual Report Download - page 166
Download and view the complete annual report
Please find page 166 of the 2009 Sallie Mae annual report below. You can navigate through the pages in the report by either clicking on the pages listed below, or by using the keyword search tool below to find specific information within the annual report.-
 1
1 -
2
-
3
-
4
-
5
-
6
-
7
-
8
-
9
-
10
-
11
-
12
-
13
-
14
-
15
-
16
-
17
-
18
-
19
-
20
-
21
-
22
-
23
-
24
-
25
-
26
-
27
-
28
-
29
-
30
-
31
-
32
-
33
-
34
-
35
-
36
-
37
-
38
-
39
-
40
-
41
-
42
-
43
-
44
-
45
-
46
-
47
-
48
-
49
-
50
-
51
-
52
-
53
-
54
-
55
-
56
-
57
-
58
-
59
-
60
-
61
-
62
-
63
-
64
-
65
-
66
-
67
-
68
-
69
-
70
-
71
-
72
-
73
-
74
-
75
-
76
-
77
-
78
-
79
-
80
-
81
-
82
-
83
-
84
-
85
-
86
-
87
-
88
-
89
-
90
-
91
-
92
-
93
-
94
-
95
-
96
-
97
-
98
-
99
-
100
-
101
-
102
-
103
-
104
-
105
-
106
-
107
-
108
-
109
-
110
-
111
-
112
-
113
-
114
-
115
-
116
-
117
-
118
-
119
-
120
-
121
-
122
-
123
-
124
-
125
-
126
-
127
-
128
-
129
-
130
-
131
-
132
-
133
-
134
-
135
-
136
-
137
-
138
-
139
-
140
-
141
-
142
-
143
-
144
-
145
-
146
-
147
-
148
-
149
-
150
-
151
-
152
-
153
-
154
-
155
-
 156
156 -
 157
157 -
 158
158 -
 159
159 -
 160
160 -
 161
161 -
 162
162 -
 163
163 -
 164
164 -
 165
165 -
 166
166 -
 167
167 -
 168
168 -
 169
169 -
 170
170 -
 171
171 -
 172
172 -
 173
173 -
 174
174 -
 175
175 -
 176
176 -
177
-
178
-
179
-
180
-
181
-
182
-
183
-
184
-
185
-
186
-
187
-
188
-
189
-
190
-
191
-
192
-
193
-
194
-
195
-
196
-
197
-
198
-
199
-
200
-
201
-
202
-
203
-
204
-
205
-
206
-
207
-
208
-
209
-
210
-
211
-
212
-
213
-
214
-
215
-
216
-
217
-
218
-
219
-
220
-
221
-
222
-
223
-
224
-
225
-
226
-
227
-
228
-
229
-
230
-
231
-
232
-
233
-
234
-
235
-
236
-
237
-
238
-
239
-
240
-
241
-
242
-
243
-
244
-
245
-
246
-
247
-
248
-
249
-
250
-
251
-
252
-
253
-
254
-
255
-
256
 |
 |

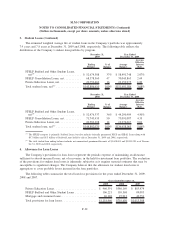
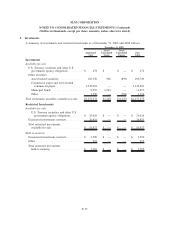
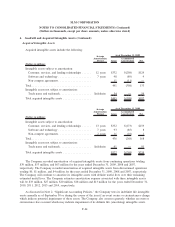
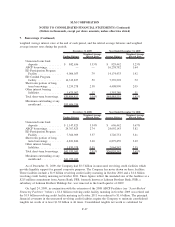
5. Investments (Continued)
As of December 31, 2009, the stated maturities for the investments (including restricted investments) are
shown in the following table:
Held-to-
Maturity
Available-for-
Sale
(1)
Other
December 31, 2009
Year of Maturity
2010 ........................................... $ 215 $1,176,675 $675,725
2011 ........................................... — — 5,162
2012 ........................................... — — —
2013 ........................................... — 751 —
2014 ........................................... — — —
2015-2019 . . ..................................... — 11,877 59,666
After 2019 . . ..................................... 3,550 135,949 739
Total ........................................... $3,765 $1,325,252 $741,292
(1)
Available-for-sale securities are stated at fair value.
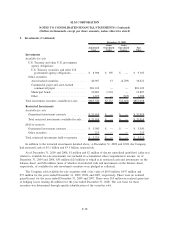
At December 31, 2009 and 2008, the Company also had other investments of $741 million and
$180 million, respectively. At December 31, 2009, other investments included a $636 million receivable for
cash collateral posted to derivative counterparties. Other investments also included leveraged leases which at
December 31, 2009 and 2008, totaled $66 million and $76 million, respectively, that are general obligations of
American Airlines and Federal Express Corporation. At December 31, 2009 and 2008, other investments also
included the Company’s remaining investment in The Reserve Primary Fund totaling $32 million and
$97 million, respectively. The Company received $32 million from The Reserve Primary Fund on January 29,
2010.
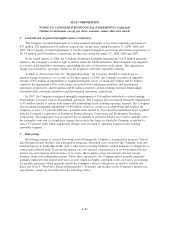
6. Goodwill and Acquired Intangible Assets
Goodwill
All acquisitions must be assigned to a reporting unit or units. A reporting unit is the same as or one level
below an operating segment. The following table summarizes the Company’s historical allocation of goodwill
to its reporting units, accumulated impairments and net goodwill for each reporting unit.
Gross
Accumulated
Impairments Net
As of December 31,
2009 and 2008
(Dollars in millions)
Lending ............................................. $ 412 $(24) $388
APG................................................ 401 — 401
Guarantor Servicing .................................... 62 — 62
Upromise ............................................ 140 — 140
Other ............................................... 1 (1) —
Total................................................ $1,016 $(25) $991
F-39
SLM CORPORATION
NOTES TO CONSOLIDATED FINANCIAL STATEMENTS (Continued)
(Dollars in thousands, except per share amounts, unless otherwise stated)