Rue 21 2011 Annual Report Download - page 9
Download and view the complete annual report
Please find page 9 of the 2011 Rue 21 annual report below. You can navigate through the pages in the report by either clicking on the pages listed below, or by using the keyword search tool below to find specific information within the annual report.-
 1
1 -
 2
2 -
 3
3 -
 4
4 -
 5
5 -
 6
6 -
 7
7 -
 8
8 -
 9
9 -
 10
10 -
 11
11 -
 12
12 -
 13
13 -
 14
14 -
 15
15 -
 16
16 -
 17
17 -
 18
18 -
 19
19 -
 20
20 -
21
-
22
-
23
-
24
-
25
-
26
-
27
-
28
-
29
-
30
-
31
-
32
-
33
-
34
-
35
-
36
-
37
-
38
-
39
-
40
-
41
-
42
-
43
-
44
-
45
-
46
-
47
-
48
-
49
-
50
-
51
-
52
-
53
-
54
-
55
-
56
-
57
-
58
-
59
-
60
-
61
-
62
-
63
-
64
-
65
-
66
-
67
-
68
-
69
-
70
-
71
-
72
-
73
-
74
 |
 |
Our comparable store sales increases were 0.4% in fiscal year 2011 and 2.1% in fiscal year 2010. Our net sales
were $760.3 million in fiscal year 2011, which represents a 19.8% increase over fiscal year 2010. Our net income
was $39.0 million in fiscal year 2011, which represents a 28.8% increase over fiscal year 2010. We believe our
trend-right merchandise assortments, compelling value proposition, and speed-to-market merchandising strategy
have contributed to our strong operating results.
Our Stores
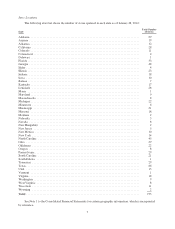
As of January 28, 2012, we operated 755 stores in 46 states throughout the United States. Our stores are located
in strip centers, regional malls and outlet centers.
6