Royal Caribbean Cruise Lines 2014 Annual Report Download - page 51
Download and view the complete annual report
Please find page 51 of the 2014 Royal Caribbean Cruise Lines annual report below. You can navigate through the pages in the report by either clicking on the pages listed below, or by using the keyword search tool below to find specific information within the annual report.-
 1
1 -
2
-
3
-
4
-
5
-
6
-
7
-
8
-
9
-
10
-
11
-
12
-
13
-
14
-
15
-
16
-
17
-
18
-
19
-
20
-
21
-
22
-
23
-
24
-
25
-
26
-
27
-
28
-
29
-
30
-
31
-
32
-
33
-
34
-
35
-
36
-
37
-
38
-
39
-
40
-
 41
41 -
 42
42 -
 43
43 -
 44
44 -
 45
45 -
 46
46 -
 47
47 -
 48
48 -
 49
49 -
 50
50 -
 51
51 -
 52
52 -
 53
53 -
 54
54 -
 55
55 -
 56
56 -
 57
57 -
 58
58 -
 59
59 -
 60
60 -
 61
61 -
62
-
63
-
64
-
65
-
66
-
67
-
68
-
69
-
70
-
71
-
72
-
73
-
74
-
75
-
76
-
77
-
78
-
79
-
80
-
81
-
82
-
83
-
84
-
85
-
86
-
87
-
88
-
89
-
90
-
91
-
92
-
93
-
94
-
95
-
96
-
97
-
98
-
99
-
100
-
101
-
102
-
103
-
104
 |
 |

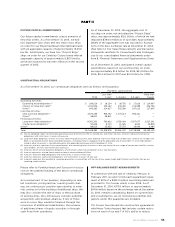
50 Royal Caribbean Cruises Ltd.
PART II
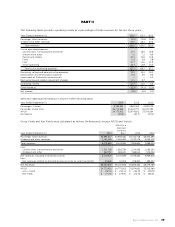
Gross Cruise Costs, Net Cruise Costs and Net Cruise Costs Excluding Fuel were calculated as follows (in thousands,
except APCD and costs per APCD):
Ona
Constant
Currency
Year Ended December 31, Basis
Total cruise operating expenses
Marketing, selling and administrative expenses
Gross Cruise Costs
Less:
Commissions, transportation and other
Onboard and other
Net Cruise Costs including divested businesses
Less:
Net Cruise Costs related to divested businesses prior to sales transaction
Other initiative costs included within cruise operating expenses and
marketing, selling and administrative expenses — —
Loss on sale of ship included within other operating expenses — —
Net Cruise Costs
Less:
Fuel
Net Cruise Costs Excluding Fuel
APCD
Gross Cruise Costs per APCD
Net Cruise Costs per APCD
Net Cruise Cost Excluding Fuel per APCD
Net Debt-to-Capital was calculated as follows
(in thousands):
As of December 31,
Long-term debt, net
of current portion
Current portion of
long-term debt
Total debt
Less: Cash and cash
equivalents
Net Debt
Total shareholders’ equity
Total debt
Total debt and
shareholders’ equity
Debt-to-Capital
Net Debt
Net Debt and
shareholders’ equity
Net Debt-to-Capital
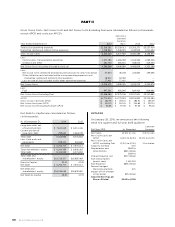
OUTLOOK
On January 29, 2015, we announced the following
initial first quarter and full year 2015 guidance:
Full Year 2015 As Reported
Constant
Currency
Net Yields ()to to
Net Cruise Costs per
APCD ()to() ()to()
Net Cruise Costs per
APCD, excluding Fuel ()to() orbetter
Capacity Increase
Depreciation and
Amortization
to
million
Interest Expense, net
to
million
Fuel Consumption
(metric tons)
Fuel Expenses million
Percent Hedged
(fwd consumption)
Impact of 10% change
in fuel prices million
Adjusted Earnings per
Share—Diluted to