Ross 2006 Annual Report Download - page 13
Download and view the complete annual report
Please find page 13 of the 2006 Ross annual report below. You can navigate through the pages in the report by either clicking on the pages listed below, or by using the keyword search tool below to find specific information within the annual report.-
 1
1 -
2
-
 3
3 -
 4
4 -
 5
5 -
 6
6 -
 7
7 -
 8
8 -
 9
9 -
 10
10 -
 11
11 -
 12
12 -
 13
13 -
 14
14 -
 15
15 -
 16
16 -
 17
17 -
 18
18 -
 19
19 -
 20
20 -
 21
21 -
 22
22 -
 23
23 -
24
-
25
-
26
-
27
-
28
-
29
-
30
-
31
-
32
-
33
-
34
-
35
-
36
-
37
-
38
-
39
-
40
-
41
-
42
-
43
-
44
-
45
-
46
-
47
-
48
-
49
-
50
-
51
-
52
-
53
-
54
-
55
-
56
-
57
-
58
-
59
-
60
-
61
-
62
-
63
-
64
-
65
-
66
-
67
-
68
-
69
-
70
-
71
-
72
-
73
-
74
-
75
-
76
-
77
-
78
-
79
-
80
 |
 |

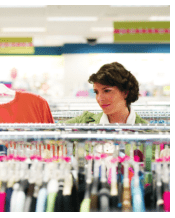
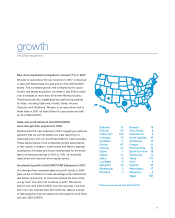
Delivering bargains remained our core strategy and focus in 2006, driving ongoing growth and results for the year:
• We continued to do what we do best—delivering bargains every day to our customers.
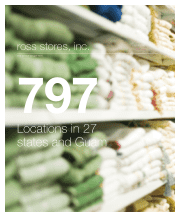
• We also continued to expand our footprint—adding 63 net new locations to end the year with 797 stores
in 27 states and Guam.
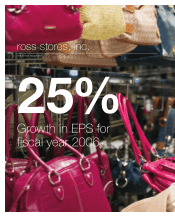
• And we delivered results, including double-digit total sales growth, a record level of net earnings and a 25%
increase in earnings per share, which was well above our 15% to 20% target.
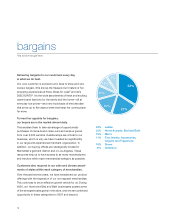
Solid Gains in Sales and Earnings
We are pleased with the progress we made in fiscal 2006. Revenues rose 13% to a record $5.6 billion, with comparable
store sales up 4% on top of a 6% increase in 2005. Geographic and merchandise trends were relatively broad-based
during the year. Our strongest markets were the Southwest, mid-Atlantic and Texas, and our top performing merchandise
categories were Home and Shoes.
During 2006, net earnings grew to a record $241.6 million, from $199.6 million in the prior year. Earnings per share
rose 25% to $1.70, compared to $1.36 for 2005. Results for 2006 include an extra week that added about $88 million
in revenue and $.07 in earnings per share, partially offset by stock option-related expenses equivalent to about $.06 per
share recognized in connection with adoption of FAS 123(R). Adjusting for the 53rd week and stock option-related
expenses, earnings per share increased 24% in 2006 compared to 2005.
Operating Initiatives Drive Improved Profitability
In 2006, we made progress across several areas of our business:
• We completed implementation of engineered standards in our distribution centers, which drove improved
productivity in these facilities and lower distribution costs as a percent of sales.
• The roll out of our shortage control initiatives early in the year contributed to reduced shrink expense.
• After adjusting inventory for supply chain efficiencies early in the year, we were able to realize lower markdowns
as a percent of sales in the second half, leading to improvement in merchandise gross margin during 2006.
• These supply chain efficiencies also allowed us to get product into our stores more quickly and to operate on
less total inventory investment, enhancing our cash position and interest income.
march 21, 2007
to our stockholders
13