Ricoh 1998 Annual Report Download - page 3
Download and view the complete annual report
Please find page 3 of the 1998 Ricoh annual report below. You can navigate through the pages in the report by either clicking on the pages listed below, or by using the keyword search tool below to find specific information within the annual report.-
 1
1 -
 2
2 -
 3
3 -
 4
4 -
 5
5 -
 6
6 -
 7
7 -
 8
8 -
 9
9 -
 10
10 -
 11
11 -
 12
12 -
 13
13 -
 14
14 -
15
-
16
-
17
-
18
-
19
-
20
-
21
-
22
-
23
-
24
-
25
-
26
-
27
-
28
-
29
-
30
-
31
-
32
-
33
-
34
-
35
-
36
-
37
-
38
-
39
-
40
-
41
-
42
-
43
-
44
-
45
-
46
-
47
-
48
-
49
-
50
-
51
-
52
-
53
-
54
-
55
-
56
 |
 |

1
0
300
600
900
1200
1500
19981997199619951994
0
1
2
3
4
5
19981997199619951994
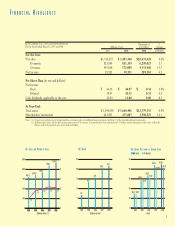
1,403.3
1,316.1
1,113.0
1,020.3
968.3
0
7
14
21
28
35
19981997199619951994
30.1
28.9
21.9
18.6
9.5
0
10
20
30
40
50
19981997199619951994
44.97
44.16
33.55
28.54
14.61
1.0
1.8 2.0 2.2 2.1
Ricoh Company, Ltd., and Consolidated Subsidiaries
For the Years Ended March 31, 1997 and 1998
F
INANCIAL
H
IGHLIGHTS
Millions of yen
1997 1998
Thousands of
U.S. dollars
1998
%
Change
1998/1997
Notes: (1) Overseas sales include sales of foreign subsidiaries and export sales to unaffiliated foreign customers. See Note 17 to the consolidated financial statements.
(2) All dollar figures above and elsewhere in this report refer to U.S. currency. Yen amounts have been translated into U.S. dollars, for the convenience of the reader, at ¥132=$1.
Billion is used in the American sense of one thousand million.
NET SALES AND RETURN ON SALES NET INCOME NET INCOME PER SHARE OF COMMON STOCK
(Billions of Yen, %) (Billions of Yen) (Yen)
For the Year:
Net sales ¥1,316,072 ¥ 1,403,348 $10,631,424 6.6%
Domestic 821,004 831,339 6,298,023 1.3
Overseas 495,068 572,009 4,333,402 15.5
Net income 28,922 30,131 228,265 4.2
Per Share Data (in yen and dollars):
Net income
Basic ¥ 44.16 ¥ 44.97 $ 0.34 1.8%
Diluted 38.95 41.35 0.31 6.2
Cash dividends, applicable to the year 12.00 11.00 0.08 -8.3
At Year-End:
Total assets ¥ 1,644,896 ¥ 1,660,496 $12,579,515 0.9%
Shareholders’ investment 422,923 475,005 3,598,523 12.3
41.35
38.95
31.21
26.43
14.47
Basic Diluted