Redbox 2013 Annual Report Download - page 104
Download and view the complete annual report
Please find page 104 of the 2013 Redbox annual report below. You can navigate through the pages in the report by either clicking on the pages listed below, or by using the keyword search tool below to find specific information within the annual report.-
 1
1 -
2
-
3
-
4
-
5
-
6
-
7
-
8
-
9
-
10
-
11
-
12
-
13
-
14
-
15
-
16
-
17
-
18
-
19
-
20
-
21
-
22
-
23
-
24
-
25
-
26
-
27
-
28
-
29
-
30
-
31
-
32
-
33
-
34
-
35
-
36
-
37
-
38
-
39
-
40
-
41
-
42
-
43
-
44
-
45
-
46
-
47
-
48
-
49
-
50
-
51
-
52
-
53
-
54
-
55
-
56
-
57
-
58
-
59
-
60
-
61
-
62
-
63
-
64
-
65
-
66
-
67
-
68
-
69
-
70
-
71
-
72
-
73
-
74
-
75
-
76
-
77
-
78
-
79
-
80
-
81
-
82
-
83
-
84
-
85
-
86
-
87
-
88
-
89
-
90
-
91
-
92
-
93
-
 94
94 -
 95
95 -
 96
96 -
 97
97 -
 98
98 -
 99
99 -
 100
100 -
 101
101 -
 102
102 -
 103
103 -
 104
104 -
 105
105 -
 106
106 -
 107
107 -
 108
108 -
 109
109 -
 110
110 -
 111
111 -
 112
112 -
 113
113 -
 114
114 -
115
-
116
-
117
-
118
-
119
 |
 |

95
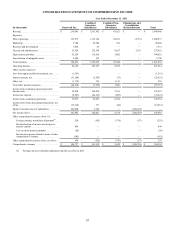
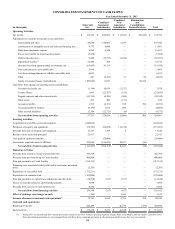
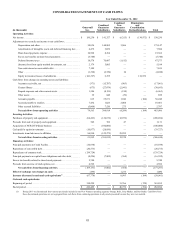
CONSOLIDATED STATEMENTS OF CASH FLOWS
Year Ended December 31, 2012
(in thousands)
Outerwall
Inc.
Combined
Guarantor
Subsidiaries
Combined
Non-
Guarantor
Subsidiaries
Eliminations
and
Consolidation
Reclassifications Total
Operating Activities:
Net income . . . . . . . . . . . . . . . . . . . . . . . . . . . . . . . . . . . . . . . . . . . . . . . $ 150,230 $ 141,327 $ (6,355) $ (134,972) $ 150,230
Adjustments to reconcile net income to net cash flows:. . . . . . . . . . . . .
Depreciation and other. . . . . . . . . . . . . . . . . . . . . . . . . . . . . . . . . . 30,836 144,805 3,506 — 179,147
Amortization of intangible assets and deferred financing fees . . . 4,472 3,032 — — 7,504
Share-based payments expense . . . . . . . . . . . . . . . . . . . . . . . . . . . 10,998 8,364 — — 19,362
Excess tax benefits on share-based payments . . . . . . . . . . . . . . . . (5,740) — — — (5,740)
Deferred income taxes . . . . . . . . . . . . . . . . . . . . . . . . . . . . . . . . . . 18,578 70,607 (1,612) — 87,573
(Income) loss from equity method investments, net . . . . . . . . . . . 2,179 3,005 — — 5,184
Non-cash interest on convertible debt . . . . . . . . . . . . . . . . . . . . . . 7,109 — — — 7,109
Other . . . . . . . . . . . . . . . . . . . . . . . . . . . . . . . . . . . . . . . . . . . . . . . (1,390) (2,720) 10 — (4,100)
Equity in (income) losses of subsidiaries. . . . . . . . . . . . . . . . . . . . (141,327) 6,355 — 134,972 —
Cash flows from changes in operating assets and liabilities:
Accounts receivable, net . . . . . . . . . . . . . . . . . . . . . . . . . . . . . . . . (371) (15,787) (903) — (17,061)
Content library . . . . . . . . . . . . . . . . . . . . . . . . . . . . . . . . . . . . . . . . (673) (27,079) (2,941) — (30,693)
Prepaid expenses and other current assets . . . . . . . . . . . . . . . . . . . 1,386 (8,159) (190) — (6,963)
Other assets . . . . . . . . . . . . . . . . . . . . . . . . . . . . . . . . . . . . . . . . . . 39 848 (29) — 858
Accounts payable. . . . . . . . . . . . . . . . . . . . . . . . . . . . . . . . . . . . . . 815 55,671 1,946 (184) 58,248
Accrued payable to retailers. . . . . . . . . . . . . . . . . . . . . . . . . . . . . . 7,432 1,025 2,004 — 10,461
Other accrued liabilities . . . . . . . . . . . . . . . . . . . . . . . . . . . . . . . . . (5,008) 7,520 275 — 2,787
Net cash flows from operating activities . . . . . . . . . . . . . . . . . . 79,565 388,814 (4,289) (184) 463,906
Investing Activities:
Purchases of property and equipment. . . . . . . . . . . . . . . . . . . . . . . . . . . (64,423) (130,672) (12,959) — (208,054)
Proceeds from sale of property and equipment. . . . . . . . . . . . . . . . . . . . 302 782 47 — 1,131
Acquisition of NCR DVD kiosk business . . . . . . . . . . . . . . . . . . . . . . . — (100,000) — — (100,000)
Cash paid for equity investments . . . . . . . . . . . . . . . . . . . . . . . . . . . . . . (10,877) (28,850) — — (39,727)
Investments in and advances to affiliates . . . . . . . . . . . . . . . . . . . . . . . . 96,990 (122,272) 25,282 — —
Net cash flows from investing activities . . . . . . . . . . . . . . . . . . . 21,992 (381,012) 12,370 — (346,650)
Financing Activities:
Principal payments on Credit Facility. . . . . . . . . . . . . . . . . . . . . . . . . . . (10,938) — — — (10,938)
Repurchase of convertible debt. . . . . . . . . . . . . . . . . . . . . . . . . . . . . . . . (20,575) — — — (20,575)
Repurchases of common stock . . . . . . . . . . . . . . . . . . . . . . . . . . . . . . . . (139,724) — — — (139,724)
Principal payments on capital lease obligations and other debt . . . . . . . (8,226) (7,802) (364) — (16,392)
Excess tax benefits related to share-based payments . . . . . . . . . . . . . . . 5,740 — — — 5,740
Proceeds from exercise of stock options, net . . . . . . . . . . . . . . . . . . . . . 4,592 — — — 4,592
Net cash flows from financing activities. . . . . . . . . . . . . . . . . . . (169,131) (7,802) (364) — (177,297)
Effect of exchange rate changes on cash . . . . . . . . . . . . . . . . . . . . . . . (196) — 1,276 — 1,080
Increase (decrease) in cash and cash equivalents(1) . . . . . . . . . . . . . . (67,770) — 8,993 (184) (58,961)
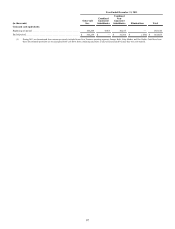
Cash and cash equivalents:
Beginning of period . . . . . . . . . . . . . . . . . . . . . . . . . . . . . . . . . . . . . . . . 310,259 — 31,766 (170) 341,855
End of period. . . . . . . . . . . . . . . . . . . . . . . . . . . . . . . . . . . . . . . . . . . . . . $ 242,489 $ — $ 40,759 $ (354) $ 282,894
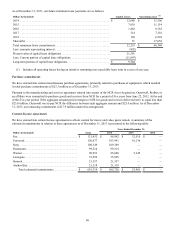
(1) During 2013 we discontinued four ventures previously included in our New Ventures operating segment, Orango, Rubi, Crisp Market, and Star Studio. Cash flows from
these discontinued operations are not segregated from cash flows from continuing operations in all periods presented because they were not material.