Redbox 2008 Annual Report Download - page 78
Download and view the complete annual report
Please find page 78 of the 2008 Redbox annual report below. You can navigate through the pages in the report by either clicking on the pages listed below, or by using the keyword search tool below to find specific information within the annual report.-
 1
1 -
2
-
3
-
4
-
5
-
6
-
7
-
8
-
9
-
10
-
11
-
12
-
13
-
14
-
15
-
16
-
17
-
18
-
19
-
20
-
21
-
22
-
23
-
24
-
25
-
26
-
27
-
28
-
29
-
30
-
31
-
32
-
33
-
34
-
35
-
36
-
37
-
38
-
39
-
40
-
41
-
42
-
43
-
44
-
45
-
46
-
47
-
48
-
49
-
50
-
51
-
52
-
53
-
54
-
55
-
56
-
57
-
58
-
59
-
60
-
61
-
62
-
63
-
64
-
65
-
66
-
67
-
 68
68 -
 69
69 -
 70
70 -
 71
71 -
 72
72 -
 73
73 -
 74
74 -
 75
75 -
 76
76 -
 77
77 -
 78
78 -
 79
79 -
 80
80 -
 81
81 -
 82
82 -
 83
83 -
 84
84 -
 85
85 -
 86
86 -
 87
87 -
 88
88 -
89
-
90
-
91
-
92
-
93
-
94
-
95
-
96
-
97
-
98
-
99
-
100
-
101
-
102
-
103
-
104
-
105
-
106
-
107
-
108
-
109
-
110
-
111
-
112
-
113
-
114
-
115
-
116
-
117
-
118
-
119
-
120
-
121
-
122
-
123
-
124
-
125
-
126
-
127
-
128
-
129
-
130
-
131
-
132
 |
 |

Our operating costs included in our shared service functions, which consist primarily of field operations, sales,
finance, legal, human resources, and information technology, are allocated to our four segments. We will
continually evaluate the shared service allocations for segment reporting purposes, which may result in changes
to segment allocations in future periods. Because our field operations are fully integrated with our Coin and
Entertainment services, our CEO allocates resources and evaluates Coin and Entertainment services results, as well
as makes strategic decisions, on a combined basis. Therefore, our Coin and Entertainment services are considered
one segment for reporting purposes. In addition, our CEO manages our business by evaluating the financial results
of the four operating segments, focusing primarily on segment revenue and segment operating income (loss) before
depreciation and amortization and unallocated expenses (“segment operating income (loss)”). We utilize segment
revenue and segment operating income (loss) because we believe they provide useful information for effectively
allocating resources among business segments, evaluating the health of our business segments based on metrics that
management can actively influence, and gauging our investments and our ability to service, incur or pay down debt.
Specifically, our CEO evaluates segment revenue and segment operating income (loss), and assesses the perfor-
mance of each business segment based on these measures, as well as, among other things, the prospects of each of
the segments and how they fit into the Company’s overall strategy. Our CEO then decides how resources should be
allocated among our business segments. Stock-based compensation expense and depreciation and amortization
expenses are not allocated to our four operating segments. As we changed our internal organization structure during
the first quarter of 2008, resulting in the change of reportable segments, we did not restate the prior period under the
new basis because it was not practical to do so.
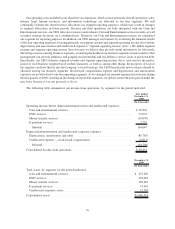
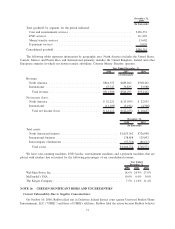
The following table summarizes our income from operations, by segment, for the period indicated:
Year Ended
December 31,
2008
(In thousands)
Operating income before depreciation/amortization and unallocated expenses:
Coin and entertainment services ....................................... $ 98,891
DVD services..................................................... 72,974
Money transfer services ............................................. (10,070)
E-payment services ................................................ 2,252
Subtotal ....................................................... 164,047
Depreciation/amortization and unallocated corporate expenses:
Depreciation, amortization and other .................................... (85,785)
Unallocated expense — stock-based compensation .......................... (8,811)
Subtotal ....................................................... (94,596)
Consolidated income from operations ..................................... $ 69,451
December 31,
2008
(In thousands)
Total assets, by segment, for the period indicated:
Coin and entertainment services ....................................... $ 473,256
DVD services..................................................... 378,092
Money transfer services ............................................. 105,645
E-payment services ................................................ 35,963
Unallocated corporate assets . . ........................................ 73,758
Consolidated assets .................................................. $1,066,714
76