Raytheon 2011 Annual Report Download - page 3
Download and view the complete annual report
Please find page 3 of the 2011 Raytheon annual report below. You can navigate through the pages in the report by either clicking on the pages listed below, or by using the keyword search tool below to find specific information within the annual report.Raytheon once again delivered solid
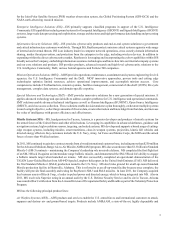
operating results. We capitalized on
global market opportunities and successfully managed the challenges of
an evolving economic environment both domestically and internationally.
In this environment, we focused on the things that we could control and
what we do best. We executed our strategy. We continued to implement
efficiencies across the businesses, lowering our costs. We provided more
affordable, innovative solutions to our customers.
This ultimately allowed us to deliver solid returns for
our shareholders. Our margins, earnings and cash flow
were all better than expected, and our bookings and
backlog were strong. For the year, our adjusted earn-
ings per share from continuing operations was $5.90
compared to $5.51 for the full-year 2010. We had strong
operating cash flow from continuing operations of $2.2
billion in 2011, compared to $1.9 billion in 2010. Both
2011 and 2010 included $750 million in discretionary
cash contributions to the company’s pension plans.
We reported strong bookings of $26.6 billion in 2011
compared to $24.4 billion in 2010, resulting in a book-
to-bill ratio of 1.07. We ended 2011 with a backlog
of $35.3 billion, compared to $34.6 billion at the end
of 2010.
Our international business was a bright spot and a key
driver of our 2011 bookings strength. International
bookings represented 29 percent of total company
bookings for the year, demonstrating the continued
success of our international strategy. We have the
DEAR FELLOW SHAREHOLDERS,
in 2011,

