Rayovac 2010 Annual Report Download - page 4
Download and view the complete annual report
Please find page 4 of the 2010 Rayovac annual report below. You can navigate through the pages in the report by either clicking on the pages listed below, or by using the keyword search tool below to find specific information within the annual report.-
 1
1 -
 2
2 -
 3
3 -
 4
4 -
 5
5 -
 6
6 -
 7
7 -
 8
8 -
 9
9 -
 10
10 -
 11
11 -
 12
12 -
 13
13 -
 14
14 -
 15
15 -
16
-
17
-
18
-
19
-
20
-
21
-
22
-
23
-
24
-
25
-
26
-
27
-
28
-
29
-
30
-
31
-
32
-
33
-
34
-
35
-
36
-
37
-
38
-
39
-
40
-
41
-
42
-
43
-
44
-
45
-
46
-
47
-
48
-
49
-
50
-
51
-
52
-
53
-
54
-
55
-
56
-
57
-
58
-
59
-
60
-
61
-
62
-
63
-
64
-
65
-
66
-
67
-
68
-
69
-
70
-
71
-
72
-
73
-
74
-
75
-
76
-
77
-
78
-
79
-
80
-
81
-
82
-
83
-
84
-
85
-
86
-
87
-
88
-
89
-
90
-
91
-
92
-
93
-
94
-
95
-
96
-
97
-
98
-
99
-
100
-
101
-
102
-
103
-
104
-
105
-
106
-
107
-
108
-
109
-
110
-
111
-
112
-
113
-
114
-
115
-
116
-
117
-
118
-
119
-
120
-
121
-
122
-
123
-
124
-
125
-
126
-
127
-
128
-
129
-
130
-
131
-
132
-
133
-
134
-
135
-
136
-
137
-
138
-
139
-
140
-
141
-
142
-
143
-
144
-
145
-
146
-
147
-
148
-
149
-
150
-
151
-
152
-
153
-
154
-
155
-
156
-
157
-
158
-
159
-
160
-
161
-
162
-
163
-
164
-
165
-
166
-
167
-
168
-
169
-
170
-
171
-
172
-
173
-
174
-
175
-
176
-
177
-
178
-
179
-
180
-
181
-
182
-
183
-
184
-
185
-
186
-
187
-
188
-
189
-
190
 |
 |

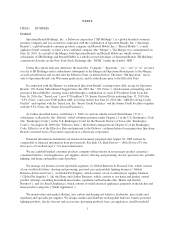
MARKET POSITIONING
Focus on #2 brands in markets with high barriers to entry
VALUE TO RETAILERS
Best retailer margin; category management; merchandising
e “Spectrum Value Model” dierentiates Spectrum
Brands and provides stability and sustainable earnings.
{
Spectrum
Value
Model
“SAME PERFORMANCE, LESS PRICE, BETTER VALUE”
1
Product Performance
Match or exceed competitor
product performance
2
Focused Investment
Invest in product performance,
R&D and cost improvement
3
Point of Sale Focus
Win at point of sale, not
through brand advertising
4
Control Costs
Shared services, global
new product development
and common platforms
ratio and extending debt maturities, while
enhancing liquidity and increasing capital
available for growth.
The Russell Hobbs integration is on track,
and we remain confi dent of achieving, and
possibly exceeding, the $25-$30 million of cost
synergies we have projected over the next
few years. There are additional opportunities to
capture revenue and new product development
synergies as we begin leveraging each
company’s regional strengths in complementary
categories. Beyond Russell Hobbs, important
integrations are occurring within our Global Pet
and Home & Garden businesses, even as we
have completed the relocation of our corporate
headquarters from Atlanta back to Madison,
Wisconsin. In short, Spectrum Brands now has
a streamlined organization aligned along global
business units, and connected through a shared
services platform.
In addition to organic growth in our business
segments, and a focus on driving more volume
through our plants to improve capacity utiliza-
tion rates, we look to grow our Global Pet and
Home & Garden segments through small, bolt-
on acquisitions. To that end, our Global Pet
business recently completed an accretive $12.5
million acquisition of Seed Resources, a leader
in the domestic wild bird seed cake business
with its well-known Birdola® premium brand.
Our Spectrum Value Model is at the heart of
our operating approach. As the accompanying
chart shows, this model emphasizes providing
value to the consumer with products that work
as well as or better than our competition for
a lower cost. We do this while also delivering
higher retailer margins. We concentrate our
efforts to win at point of sale and on creating and
maintaining a low-cost, effi cient operating struc-
ture that allows our top-line growth to contribute
directly to our profi tability. This operating model
permeates our businesses. We live it every day.
We believe our superior value brand strategy
is working well. We are maintaining or growing
share in most of our key product categories.
We continue to target driving our cost structure
down and intend to move rapidly to strengthen
our balance sheet with further and regular debt
reduction payments.
The result is a more accountable, agile and
competitive Spectrum Brands – a business
much better positioned to generate steady and
profi table margins. Although market conditions
change constantly, our brand fundamentals –
from manufacturing and distribution to product
development and market position – are solid.
As a result, we are confi dent in the ability of our
focused businesses to more fully realize their
potential going forward as businesses designed
to deliver strong, consistent cash fl ow.