Qualcomm 2005 Annual Report Download - page 2
Download and view the complete annual report
Please find page 2 of the 2005 Qualcomm annual report below. You can navigate through the pages in the report by either clicking on the pages listed below, or by using the keyword search tool below to find specific information within the annual report.-
 1
1 -
 2
2 -
 3
3 -
 4
4 -
 5
5 -
 6
6 -
 7
7 -
 8
8 -
 9
9 -
 10
10 -
 11
11 -
 12
12 -
 13
13 -
14
-
15
-
16
-
17
-
18
-
19
-
20
-
21
-
22
-
23
-
24
-
25
-
26
-
27
-
28
-
29
-
30
-
31
-
32
-
33
-
34
-
35
-
36
-
37
-
38
-
39
-
40
-
41
-
42
-
43
-
44
-
45
-
46
-
47
-
48
-
49
-
50
-
51
-
52
-
53
-
54
-
55
-
56
-
57
-
58
-
59
-
60
-
61
-
62
-
63
-
64
-
65
-
66
-
67
-
68
-
69
-
70
-
71
-
72
-
73
-
74
-
75
-
76
-
77
-
78
-
79
-
80
-
81
-
82
 |
 |

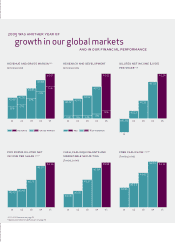
pro forma diluted net
income per share (2) (3) *
cash, cash equivalents and
marketable securities
$ in billions
free cash fl ow
(1) (3) (4) *
$ in billions
01 02 03 04 05
$2.58
$3.20
$5.37
$7.64
$8.68
01 02 03 04 05
$0.94
$1.14
$1.62
$2.15 $2.11
01 02 03 04 05
$0.43 $0.48
$0.71
$1.07
$1.16
revenue and gross margin (1) (5)
$ in billions
research and development
$ in billions
revenue gross margin r&d% of revenue
01 02 03 04 05
$2.68
61% 67%
67%
70%
71%
$2.92
$3.85
$4.88
$5.67
01 02 03 04 05
$0.42
15% 15% 14% 15%
18%
$0.45
$0.52
$0.72
$1.01
01
02 03 04 05
($0.38)
$0.22
$0.51
$1.03
$1.26
2005 was another year of
growth in our global markets
and in our fi nancial performance
diluted net income (loss)
per share (2) (5)
(1) (2) (3) (4) (5) See notes on page 74.
* See reconciliation to GAAP amounts on page 76.
2005 was another year of
growth in our global markets
and in our fi nancial performance