Public Storage 2003 Annual Report Download - page 6
Download and view the complete annual report
Please find page 6 of the 2003 Public Storage annual report below. You can navigate through the pages in the report by either clicking on the pages listed below, or by using the keyword search tool below to find specific information within the annual report.-
 1
1 -
 2
2 -
 3
3 -
 4
4 -
 5
5 -
 6
6 -
 7
7 -
 8
8 -
 9
9 -
 10
10 -
 11
11 -
 12
12 -
 13
13 -
 14
14 -
 15
15 -
 16
16 -
 17
17 -
18
-
19
-
20
-
21
-
22
-
23
-
24
-
25
-
26
-
27
-
28
-
29
-
30
-
31
-
32
-
33
-
34
-
35
-
36
-
37
-
38
-
39
-
40
-
41
-
42
-
43
-
44
-
45
-
46
-
47
-
48
-
49
-
50
-
51
-
52
-
53
-
54
-
55
-
56
-
57
-
58
-
59
-
60
-
61
-
62
-
63
-
64
-
65
-
66
-
67
-
68
-
69
-
70
-
71
-
72
-
73
-
74
-
75
-
76
-
77
-
78
-
79
-
80
-
81
-
82
-
83
-
84
-
85
-
86
-
87
-
88
-
89
-
90
-
91
-
92
-
93
-
94
-
95
-
96
-
97
-
98
-
99
-
100
-
101
-
102
-
103
-
104
-
105
-
106
-
107
-
108
-
109
-
110
-
111
-
112
-
113
-
114
-
115
-
116
-
117
-
118
-
119
-
120
-
121
-
122
-
123
-
124
-
125
-
126
-
127
-
128
-
129
-
130
-
131
-
132
-
133
-
134
-
135
-
136
-
137
-
138
-
139
-
140
-
141
-
142
-
143
-
144
-
145
-
146
-
147
-
148
-
149
-
150
-
151
-
152
-
153
-
154
-
155
-
156
-
157
-
158
-
159
-
160
-
161
-
162
-
163
-
164
-
165
-
166
-
167
-
168
-
169
 |
 |

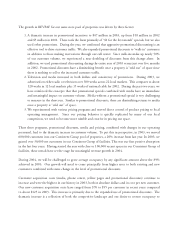
The growth in REVPAF for our same store pool of properties was driven by three factors:
1. A dramatic increase in promotional incentives to $47 million in 2003, up from $18 million in 2002
and $5 million in 2001. These took the form primarily of $1 for the first month specials, but we also
used other promotions. During the year, we confirmed that aggressive promotional discounting is an
effective tool to drive customer traffic. We also expanded promotional discounts to walk-in customers
in addition to those making reservations through our call center. Since walk-ins make up nearly 50%
of our customer volume, we experienced a near doubling of discounts from this change alone. In
addition, we used promotional discounting during the entire year of 2003 versus just over five months
in 2002. Promotional discounts have a diminishing benefit once a property is sold out of space since
there is nothing to sell to the increased customer traffic.
2. Television and media increased in both dollars and consistency of promotions. During 2003, we
advertised on either radio or television over 300 weeks across 22 local markets. This compares to about
120 weeks in 12 local markets plus 15 weeks of national cable for 2002. During the past two years, we
have reinforced the concepts that that promotional specials combined with media have an immediate
and meaningful impact on customer volume. Media without a promotional special is very challenging
to measure in the short run. Similar to promotional discounts, there are diminishing returns to media
once a property is sold out of space.
3. We experimented with various pricing programs and moved direct control of product pricing to local
operating management. Since our pricing behavior is quickly replicated by many of our local
competitors, we need to become more nimble and creative in pricing our space.
These three programs, promotional discounts, media and pricing, combined with changes in our operating
personnel, lead to the dramatic increase in customer volume. To put this in perspective, in 2003, we moved
600,000 customers into our Consistent Group pool of properties, a 20% increase from last year. In 2003, we
gained over 30,000 net customers in our Consistent Group of facilities. This was our first positive absorption
in the last four years. Having started the year with close to 100,000 vacant spaces in our Consistent Group of
facilities, these rentals have set the stage for meaningful revenue growth in 2004.
During 2004, we will be challenged to grow average occupancy by any significant amount above the 89%
achieved in 2003. Our growth will need to come principally from higher rates to both existing and new
customers combined with some change in the level of promotional discounts.
Customer acquisition costs (media, phone center, yellow pages and promotional discounts) continue to
increase and were the highest in our history in 2003, both in absolute dollars and in cost per new customer.
Our new customer acquisition costs have ranged from $70 to $95 per customer in recent years compared
to about $125 in 2003. This increase is primarily due to the expanded use of promotional discounts. The
dramatic increase is a reflection of both the competitive landscape and our desire to restore occupancy to