Public Storage 2003 Annual Report Download - page 10
Download and view the complete annual report
Please find page 10 of the 2003 Public Storage annual report below. You can navigate through the pages in the report by either clicking on the pages listed below, or by using the keyword search tool below to find specific information within the annual report.-
 1
1 -
 2
2 -
 3
3 -
 4
4 -
 5
5 -
 6
6 -
 7
7 -
 8
8 -
 9
9 -
 10
10 -
 11
11 -
 12
12 -
 13
13 -
 14
14 -
 15
15 -
 16
16 -
 17
17 -
 18
18 -
 19
19 -
 20
20 -
 21
21 -
22
-
23
-
24
-
25
-
26
-
27
-
28
-
29
-
30
-
31
-
32
-
33
-
34
-
35
-
36
-
37
-
38
-
39
-
40
-
41
-
42
-
43
-
44
-
45
-
46
-
47
-
48
-
49
-
50
-
51
-
52
-
53
-
54
-
55
-
56
-
57
-
58
-
59
-
60
-
61
-
62
-
63
-
64
-
65
-
66
-
67
-
68
-
69
-
70
-
71
-
72
-
73
-
74
-
75
-
76
-
77
-
78
-
79
-
80
-
81
-
82
-
83
-
84
-
85
-
86
-
87
-
88
-
89
-
90
-
91
-
92
-
93
-
94
-
95
-
96
-
97
-
98
-
99
-
100
-
101
-
102
-
103
-
104
-
105
-
106
-
107
-
108
-
109
-
110
-
111
-
112
-
113
-
114
-
115
-
116
-
117
-
118
-
119
-
120
-
121
-
122
-
123
-
124
-
125
-
126
-
127
-
128
-
129
-
130
-
131
-
132
-
133
-
134
-
135
-
136
-
137
-
138
-
139
-
140
-
141
-
142
-
143
-
144
-
145
-
146
-
147
-
148
-
149
-
150
-
151
-
152
-
153
-
154
-
155
-
156
-
157
-
158
-
159
-
160
-
161
-
162
-
163
-
164
-
165
-
166
-
167
-
168
-
169
 |
 |

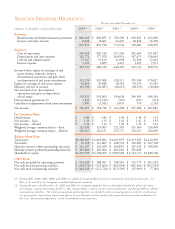
For the year ended December 31,
(Dollar amounts in thousands, except per share amounts) 2003 2002 2001
Net income $ 336,653 $ 318,738 $ 324,208
Depreciation and amortization 185,775 177,978 164,914
Depreciation/amortization included in
discontinued operations 2,228 3,670 3,147
Less - depreciation with respect to non-real estate assets (6,206) (6,053) (5,851)
(Gain) loss on sale of real estate assets (6,128) 2,541 (4,091)
Less - our share of PSB's gain on sale of real estate (2,786) (4,133)
Depreciation from unconsolidated real estate investments 27,753 27,078 25,096
Minority interest in income 43,703 44,087 46,015
Net cash provided by operating activities 580,992 563,906 553,438
FFO to minority interests - common (23,125) (25,268) (22,125)
FFO to minority interests - preferred (26,906) (26,906) (31,737)
Funds from operations 530,961 511,732 499,576
Senior Preferred (153,316) (155,814) (132,814)
Equity Stock, Series A (21,501) (21,501) (19,455)
Less: FFO allocated to preferred stock and equity stock (174,817) (177,315) (152,269)
Funds from operations to Common and Class B
Common Stock $ 356,144 $ 334,417 $ 347,307
Weighted average shares:
Regular common shares 125,181 116,075 115,520
Class B common stock 7,000 7,000
Stock option dilution 1,336 1,566 1,267
Weighted average common shares for purpose of
computing fully-diluted FFO per common share 126,517 124,641 123,787
FFO per common share $ 2.81 $ 2.68 $ 2.81
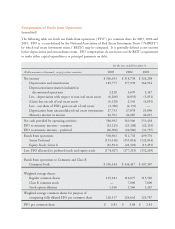
Computation of Funds from Operations
(unaudited)
The following table sets forth our funds from operations (FFO) per common share for 2003, 2002 and
2001. FFO is a term defined by the National Association of Real Estate Investment Trusts (NAREIT)
by which real estate investment trusts (REITs) may be compared. It is generally defined as net income
before depreciation and extraordinary items. FFO computations do not factor out the REITs requirement
to make either capital expenditures or principal payments on debt.