Progressive 2015 Annual Report Download - page 3
Download and view the complete annual report
Please find page 3 of the 2015 Progressive annual report below. You can navigate through the pages in the report by either clicking on the pages listed below, or by using the keyword search tool below to find specific information within the annual report.-
 1
1 -
 2
2 -
 3
3 -
 4
4 -
 5
5 -
 6
6 -
 7
7 -
 8
8 -
 9
9 -
 10
10 -
 11
11 -
 12
12 -
 13
13 -
 14
14 -
15
-
16
-
17
-
18
-
19
-
20
-
21
-
22
-
23
-
24
-
25
-
26
-
27
-
28
-
29
-
30
-
31
-
32
-
33
-
34
-
35
-
36
-
37
-
38
-
39
-
40
-
41
-
42
-
43
-
44
-
45
-
46
-
47
-
48
-
49
-
50
-
51
-
52
-
53
-
54
-
55
-
56
-
57
-
58
-
59
-
60
-
61
-
62
-
63
-
64
-
65
-
66
-
67
-
68
-
69
-
70
-
71
-
72
-
73
-
74
-
75
-
76
-
77
-
78
-
79
-
80
-
81
-
82
-
83
-
84
-
85
-
86
-
87
-
88
-
89
-
90
-
91
-
92
-
93
-
94
-
95
-
96
-
97
-
98
 |
 |

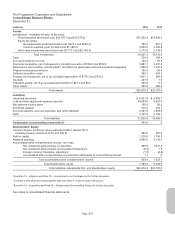
The Progressive Corporation and Subsidiaries
Consolidated Statements of Comprehensive Income
For the years ended December 31,
(millions – except per share amounts) 2015 2014 2013
Revenues
Net premiums earned $19,899.1 $18,398.5 $17,103.4
Investment income 454.6 408.4 422.0
Net realized gains (losses) on securities:
Other-than-temporary impairment (OTTI) losses:
Total OTTI losses (23.8) (7.9) (6.0)
Non-credit losses, net of credit losses recognized on previously
recorded non-credit OTTI losses 0 0 (0.1)
Net impairment losses recognized in earnings (23.8) (7.9) (6.1)
Net realized gains (losses) on securities 136.5 232.1 324.5
Total net realized gains (losses) on securities 112.7 224.2 318.4
Fees and other revenues 302.0 309.1 291.8
Service revenues 86.3 56.0 39.6
Gains (losses) on extinguishment of debt (0.9) (4.8) (4.3)
Total revenues 20,853.8 19,391.4 18,170.9
Expenses
Losses and loss adjustment expenses 14,342.0 13,306.2 12,472.4
Policy acquisition costs 1,651.8 1,524.0 1,451.8
Other underwriting expenses 2,712.1 2,467.1 2,350.9
Investment expenses 22.8 18.9 18.8
Service expenses 77.5 50.9 38.8
Interest expense 136.0 116.9 118.2
Total expenses 18,942.2 17,484.0 16,450.9
Net Income
Income before income taxes 1,911.6 1,907.4 1,720.0
Provision for income taxes 611.1 626.4 554.6
Net income 1,300.5 1,281.0 1,165.4
Net income attributable to noncontrolling interest (NCI), net of tax 32.9 0 0
Net income attributable to Progressive $ 1,267.6 $ 1,281.0 $ 1,165.4
Other Comprehensive Income (Loss), Net of Tax
Changes in:
Net unrealized gains (losses) on securities:
Net non-credit related OTTI losses, adjusted for valuation changes $ 0 $ 0 $ 0.3
Other net unrealized gains (losses) on securities (212.9) 74.9 84.0
Total net unrealized gains (losses) on securities (212.9) 74.9 84.3
Net unrealized gains (losses) on forecasted transactions (9.7) (2.6) (2.0)
Foreign currency translation adjustment (1.2) (0.9) (1.6)
Other comprehensive income (loss) (223.8) 71.4 80.7
Other comprehensive (income) loss attributable to NCI 1.1 0 0
Comprehensive income attributable to Progressive $ 1,044.9 $ 1,352.4 $ 1,246.1
Computation of Net Income Per Share
Average shares outstanding – Basic 585.5 590.6 599.1
Net effect of dilutive stock-based compensation 3.7 4.2 4.5
Total equivalent shares – Diluted 589.2 594.8 603.6
Basic: Net income per share $ 2.16 $ 2.17 $ 1.95
Diluted: Net income per share $ 2.15 $ 2.15 $ 1.93
See notes to consolidated financial statements.
App.-A-2