Progressive 2008 Annual Report Download - page 10
Download and view the complete annual report
Please find page 10 of the 2008 Progressive annual report below. You can navigate through the pages in the report by either clicking on the pages listed below, or by using the keyword search tool below to find specific information within the annual report.-
 1
1 -
 2
2 -
 3
3 -
 4
4 -
 5
5 -
 6
6 -
 7
7 -
 8
8 -
 9
9 -
 10
10 -
 11
11 -
 12
12 -
 13
13 -
 14
14 -
 15
15 -
 16
16 -
 17
17 -
 18
18 -
 19
19 -
 20
20 -
 21
21 -
22
-
23
-
24
-
25
-
26
-
27
-
28
-
29
-
30
-
31
-
32
-
33
-
34
-
35
-
36
-
37
-
38
-
39
 |
 |

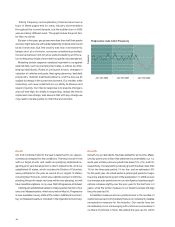
Falling frequency and explanatory theories have been a
topic in these pages and for many industry commentators
throughout the current decade, but the sudden turn in 2008
was an entirely different event. The graph makes the point bet-
ter than my words.
By later in the year, gas prices were less than half their peaks
and one might assume with perfect elasticity of demand all
would
be as it once was. But, the country was now in an economic
tailspin and, at a minimum, consumer uncertainty prevailed.
Consumer behavior did not show perfect elasticity and the re-
turn to frequency levels of even the first quarter was dampened.
Modeling certain response variables important to us against
external data, such as unemployment rates, is critical, but chal-
lenging statistically. Rates of uninsured drivers, changes in
valuation of vehicles and parts, fleet aging dynamics, bad debt
propensity, medical treatment patterns, and the like are all
subject to change in the current environment. Our models, while
interesting, will never substitute for our ability to observe and
respond quickly. Our internal response is to assume change is
at an all-time high, be nimble in responding, reduce the time to
implement rate change, and assume that with any change we
may need to iterate quickly to match the environment.
10
Profit
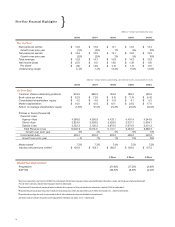
Our 94.6 combined ratio for the year is testament to our respon
-
siveness and respect for the conditions. The result is well in-line
with our target of a 96, and needs no qualifying statements re-
garding prior year development or storm adjustments.42 of our
established 50 states, which includes the District of Columbia,
were profitable for the year as were 8of our largest 10 states,
including New York auto, which was a definite concern in 2007. Du
-
plicating this profit margin next year will be very pleasing, but will
take incredible vigilance. In my view, that’s Progressive at its best.
I distinguish established states to make special mention of our
entry into Massachusetts, which occurred on May1st. Progressive
is now available in every state of the nation. Additional commen-
tary on Massachusetts is included in the Operations Summary.
Growth
Growth, by our standards, has been stalled for some time. Meas-
ured by premiums written that statement is undeniable; our 1,3,
and 5year written premium growth has been (1)%, (1)%, and 3%,
respectively. Corresponding industry growth has been less than
1% for the three year period,1% for five, and an estimated .5%
for the past year.As noted earlier a prolonged period of nega-
tive price adjustments is part of the explanation. In 2008 we saw
our average auto premiums on our new Agency busi
ness appli-
cations increase slightly over the prior year for the first
time in 2
years, while the similar measure in our Direct business still lags
the prior year by 6%.
A healthier measure and our preferred one is the number of
customers served. Unfortunately there is no consistently reliable
comparative measure for the industry. Our results here are
considerably more encouraging with continuous increases in
numbers of policies in force. We ended the year up 3%, which
Frequency
Progressive: Auto Claim Frequency
Jan–Dec 2006 Jan–Dec 2007 Jan–Dec 2008