Popeye's 2007 Annual Report Download - page 10
Download and view the complete annual report
Please find page 10 of the 2007 Popeye's annual report below. You can navigate through the pages in the report by either clicking on the pages listed below, or by using the keyword search tool below to find specific information within the annual report.-
 1
1 -
 2
2 -
 3
3 -
 4
4 -
 5
5 -
 6
6 -
 7
7 -
 8
8 -
 9
9 -
 10
10 -
 11
11 -
 12
12
 |
 |

8 AFC ENTERPRISES, INC.
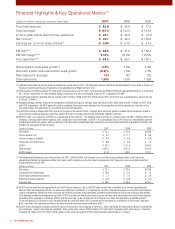
Financial Highlights & Key Operational Metrics(1)
(Dollars in millions, except per common share data) 2007 2006 2005
Franchise revenues $ 82.8 $ 82.6 $ 77.5
Total revenues(2) $ 167.3 $ 153.0 $ 143.4
Income (loss) before discontinued operations $ 23.1 $ 22.2 $ (8.4)
Net income(3) $ 23.1 $ 22.4 $ 149.6
Earnings per common share, diluted(4) $ 0.80 $ 0.75 $ 5.14
EBITDA(5,6,8) $ 52.5 $ 51.9 $ 158.4
EBITDA margin(5,6,8) 31.4% 33.9% 110.5%
Free cash flow(5,7,8) $ 28.5 $ 29.4 $ 158.1
Global system-wide sales growth(9) 0.3% 7.0% 4.8%
Domestic system-wide same-store sales growth (2.3)% 1.6% 3.3%
New restaurant openings 124 142 123
Total restaurants 1,905 1,878 1,828
(1) Additional information concerning financial performance can be found in AFC’s Consolidated Financial Statements and Management’s Discussion & Analysis of
Financial Condition and Results of Operations in the attached Annual Report on Form 10-K.
(2) Total revenues for 2006 included a 53rd week which increased sales by $2.5 million. Total revenues for 2006 and 2005 included approximately $1.2 million and
$2.7 million, respectively, in sales related to Popeyes franchisees that were consolidated as part of AFC’s adoption of FIN 46R.
(3) Discontinued operations provided after-tax income of $0.2 million in 2006 and $158.0 million during 2005 (all of which was associated with a gain on the sale
of Church’s Chicken).
(4) Weighted average common shares for the computation of diluted earnings per common share were 28.8 million, 29.8 million and 29.1 million for 2007, 2006
and 2005, respectively. For 2005 potentially dilutive employee stock options were excluded from the computation of dilutive earnings per share due to the
anti-dilutive effect they would have on “loss before discontinued operations.”
(5) In 2005 the Company recognized $158.0 million for the gain on the sale of Church’s Chicken, $8.3 million for general and administrative expenses related to
restructuring of corporate operations and other and $21.8 million of charges related to the shareholder litigation settlement.
(6) EBITDA margin is an expression of EBITDA as a percentage of total revenues. The following table reconciles on a historical basis for 2007, 2006 and 2005, the
Company’s earnings before interest expense, taxes, depreciation and amortization (“EBITDA”) on a consolidated basis to the line on our consolidated statement
of operations entitled net income, which we believe is the most directly comparable GAAP measure on our consolidated statement of operations to EBITDA and
provides the calculation of EBITDA margin:
(Dollars in millions) 2007 2006 2005
Net income $ 23.1 $ 22.4 $ 149.6
Interest expense, net $ 8.7 $ 11.1 $ 6.8
Income tax expense (benefit) $ 13.8 $ 12.0 $ (5.3)
Depreciation and amortization $ 6.9 $ 6.4 $ 7.3
EBITDA $ 52.5 $ 51.9 $ 158.4
Total revenues $ 167.3 $ 153.0 $ 143.4
EBITDA margin 31.4% 33.9% 110.5%
(7) The following table reconciles on a historical basis for 2007, 2006 and 2005, the Company’s free cash flow on a consolidated basis to the line on our
consolidated statement of operations entitled net income, which we believe is the most directly comparable GAAP measure on our consolidated statement
of operations to free cash flow:
(Dollars in millions) 2007 2006 2005
Net income $ 23.1 $ 22.4 $ 149.6
Depreciation and amortization $ 6.9 $ 6.4 $ 7.3
Stock-based compensation expense $ 1.7 $ 3.4 $ 2.9
Maintenance capital expenses $ (3.2) $ (2.8) $ (1.7)
Free cash flow $ 28.5 $ 29.4 $ 158.1
(8) EBITDA and free cash flow are supplemental non-GAAP financial measures. We use EBITDA and free cash flow, in addition to net income, operating profit
and cash flows from operating activities, to assess our performance and believe it is important for investors to be able to evaluate us using the same measures
used by management. We believe these measures are important indicators of our operational strength and performance of our business because they provide
a link between profitability and operating cash flow. EBITDA and free cash flow as calculated by us are not necessarily comparable to similarly titled measures
reported by other companies. In addition, EBITDA and free cash flow: (a) do not represent net income or cash flows from operations as defined by GAAP;
(b) are not necessarily indicative of cash available to fund our cash flow needs; and (c) should not be considered as an alternative to net income, operating
profit, cash flows from operating activities or our other financial information determined under GAAP.
(9) System-wide sales growth calculates combined sales of all restaurants that we operate or franchise. Sales information for franchised restaurants is provided by
our franchisees. System-wide sales are unaudited. Total system-wide sales in 2006 included a 53rd week which increased system-wide sales by 1.8 percent.
Excluding the impact of the 53rd week in 2006, global system-wide sales growth in 2007 would have been approximately 2.1 percent.