Polaris 2006 Annual Report Download - page 3
Download and view the complete annual report
Please find page 3 of the 2006 Polaris annual report below. You can navigate through the pages in the report by either clicking on the pages listed below, or by using the keyword search tool below to find specific information within the annual report.-
 1
1 -
 2
2 -
 3
3 -
 4
4 -
 5
5 -
 6
6 -
 7
7 -
 8
8 -
 9
9 -
 10
10 -
 11
11 -
 12
12 -
 13
13 -
 14
14 -
15
-
16
-
17
-
18
 |
 |

$1.99
03
$1.81
02
$1.64
01
$1.48
00
$1.40
9998
$3.15
$2.72
97 04 06
$2.28
$2.97
05
$2.58
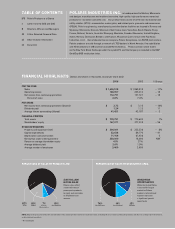
$1,327
02
$1,245
01
$1,106
00
$948
999897
$1,773
$1,870
03 05
$1,657
06
$1,427
$1,552
04
$1,468
SALES
(dollars in millions)
NET INCOME
FROM CONTINUING OPERATIONS
PER SHARE(1)
(dollars)
THE
SCORECARD
46%
02
50%
01
47%
00
46%
999897
38%
37%
03 05
41%
06
42%
38%
04
41%
RETURN ON AVERAGE SHAREHOLDER EQUITY
FROM CONTINUING OPERATIONS
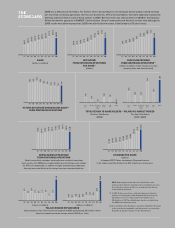
21.0%
03
21.2%
02
20.1%
01
18.8%
00
20.1%
9998
22.0%
21.7%
97 04 06
22.1%
23.5%
05
22.9%
GROSS MARGIN PERCENTAGE
FROM CONTINUING OPERATIONS
Polaris’ productivity strategies historically have resulted in consistent
gross margins. The 2006 gross margin decline was due to lower sales volume
for ATVs and snowmobiles, in addition to higher promotional and floor plan
financing costs partially offset by savings from cost reduction initiatives.
–4%
16%
Polaris
19%
S&P
500
–2%
Russell
2000
19%
Recreational
Vehicles
Index
Dow
Jones
10%
Nasdaq
80%
35%
Polaris
73%
S&P
500
23%
Russell
2000
39%
Recreational
Vehicles
Index
Dow
Jones
Nasdaq
24%
TOTAL RETURN TO SHAREHOLDERS – POLARIS VS. MARKET INDICES
One-Year Total Return
(2006)
Five-Year Total Return
(2002–2006)
$0.50
03
$0.44
02
$0.40
01
$0.36
00
$0.32
9998
$1.12
$1.24
97 04 06
$0.56
$0.92
05
$0.62
$151
03
$130
02
$120
01
$110
00
$101
9998
$211
$178
97 04 06
$177
$202
05
$179
DIVIDENDS PER SHARE
(dollars)
In January 2007, Polaris announced a 10 percent increase
in the regular quarterly dividend, the 12th straight year of increases.
CASH FLOW PROVIDED
FROM CONTINUING OPERATIONS(1,2)
(dollars in millions, before changes in current
operating items and deferred taxes)
2.4
02
3.0
01
2.2
00
2.9
999897
1.4
2.4
03 05
6.9
06
2.2
2.5
04
2.4
$40
02
$52
01
$38
00
$40
999897
$67
$132
03 05
$308
06
$49
$73
04
$76
POLARIS SHARES REPURCHASED
Since inception of the share repurchase program in 1996, approximately 29.2 million shares
have been repurchased at an average price of $30.41 per share.
(shares in millions) (dollars in millions)
(1) In 1998, Polaris entered into a settlement agreement related to
a trade secret infringement claim brought by Injection Research
Specialists, Inc. The one-time provision for litigation loss of
$61.4 million, or $0.77 per diluted share, has been excluded from
the 1998 financial data presented.
(2) A reconciliation of the Company’s calculation of Cash Flow Provided
to the most directly comparable cash flow measure, as required by
Regulation G, appears on page 11 of this Annual Report.
NOTE: All periods presented reflect the classification of the
marine products division’s financial results, including the loss from
discontinued operations and the loss on disposal of the division,
as discontinued operations.
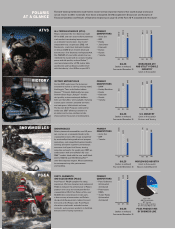
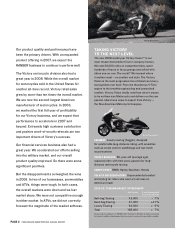
2006 was a difficult year for Polaris. For the first time in the last 25 years, the Company did not produce record earnings
per share from continuing operations. Our two core businesses, ATVs and snowmobiles, were both negatively impacted by
declining industry trends in each of these markets in 2006. But there were also some positives in 2006 for the Company.
Polaris had another good year in
RANGER
™ utility vehicles, Victory®motorcycles and financial services. And although the
2006 results were below expectations, 2006 was still the third-best year in the Company’s 53-year history.