Pioneer 2016 Annual Report Download - page 4
Download and view the complete annual report
Please find page 4 of the 2016 Pioneer annual report below. You can navigate through the pages in the report by either clicking on the pages listed below, or by using the keyword search tool below to find specific information within the annual report.-
 1
1 -
 2
2 -
 3
3 -
 4
4 -
 5
5 -
 6
6 -
 7
7 -
 8
8 -
 9
9 -
 10
10 -
 11
11 -
 12
12 -
 13
13 -
 14
14 -
 15
15 -
16
-
17
-
18
-
19
-
20
-
21
-
22
-
23
-
24
-
25
-
26
-
27
-
28
-
29
-
30
-
31
-
32
-
33
-
34
-
35
-
36
-
37
-
38
-
39
-
40
-
41
-
42
-
43
-
44
-
45
-
46
-
47
-
48
-
49
-
50
-
51
-
52
-
53
-
54
-
55
-
56
-
57
-
58
-
59
-
60
 |
 |

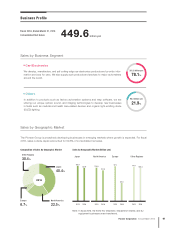
During scal 2016, ended March 31, 2016, we concentrated management resources in the Car
Electronics business, which continues to grow around the world, as our rst step toward the
building of a new Pioneer.
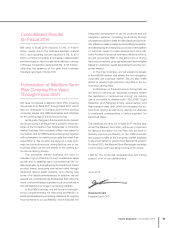
Going forward, we will work toward the solid achievement of the goals set in our newly
formulated Medium-Term Plan, while making every effort to become a leading company in
“Comprehensive Infotainment” that creates comfort, excitement, reliability and safety in vehicles.
Financial Highlights
Pioneer Corporation and Its Subsidiaries
Years Ended March 31
In millions of yen and thousands of U.S. dollars 2015 2016 2016
Net sales ¥501,676 ¥449,630 $3,979,027
Operating income 7,778 7,304 64,637
Net income attributable to owners of Pioneer Corporation
14,632 731 6,469
Net income per share (yen/U.S. dollars) 39.85 1.99 0.02
Total assets 328,277 298,012 2,637,274
Total equity 107,066 90,486 800,761
Free cash flows 71,444 (791) (7,000)
To Our Stakeholders
Notes: 1. The U.S. dollar amounts represent translations of Japanese yen, for convenience only, at the rate of ¥113=US$1.00,
the approximate rate prevailing on March 31, 2016.
2. Net income attributable to owners of Pioneer Corporation in the year ended March 31, 2015, includes the gain from
the transfer of the DJ equipment business, etc.
3. Net income per share is calculated based on the number of shares outstanding, excluding treasury stock.
4. Free cash ows represent the sum of cash ows from operating activities and cash ows from investing activities.
02 Pioneer Corporation Annual Report 2016