Pepsi 2006 Annual Report Download - page 11
Download and view the complete annual report
Please find page 11 of the 2006 Pepsi annual report below. You can navigate through the pages in the report by either clicking on the pages listed below, or by using the keyword search tool below to find specific information within the annual report.-
 1
1 -
 2
2 -
 3
3 -
 4
4 -
 5
5 -
 6
6 -
 7
7 -
 8
8 -
 9
9 -
 10
10 -
 11
11 -
 12
12 -
 13
13 -
 14
14 -
 15
15 -
 16
16 -
 17
17 -
 18
18 -
 19
19 -
 20
20 -
 21
21 -
 22
22 -
23
-
24
-
25
-
26
-
27
-
28
-
29
-
30
-
31
-
32
-
33
-
34
-
35
-
36
-
37
-
38
-
39
-
40
-
41
-
42
-
43
-
44
-
45
-
46
-
47
-
48
-
49
-
50
-
51
-
52
-
53
-
54
-
55
-
56
-
57
-
58
-
59
-
60
-
61
-
62
-
63
-
64
-
65
-
66
-
67
-
68
-
69
-
70
-
71
-
72
-
73
-
74
-
75
-
76
-
77
-
78
-
79
-
80
-
81
-
82
-
83
-
84
-
85
-
86
 |
 |

PepsiCo has a history of delivering strong financial performance. We strive to increase
revenues, market share, volume, profits and earnings per share, while reducing costs
and improving productivity. This, in turn, leads to strong returns for our shareholders.
Our success in 2006 made PepsiCo the second–largest food and beverage company
in the world. We believe our performance is the result of our unique competitive
strengths: our structural and capability advantages, supported by a culture that is
uniquely our own.
Our Structural Advantages
Our structural advantages reflect a presence in convenience categories that is both wide and
deep — with global operations that reach approximately 200 snack and beverage markets and
an unmatched portfolio of leading brands. Combined with our flexible, multiple go-to-market
systems, these structural advantages provide us with a solid base for growth.
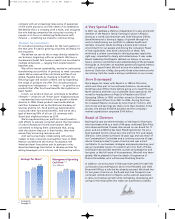
9
Performance
0 1020304050607080
PepsiCo
Kraft Foods
Nestlé
Diageo
Coca-Cola
Unilever
Groupe Danone
Cadbury Schweppes
Anheuser-Busch
General Mills
Top Branded Food and Beverage Manufacturers
$ Net Sales in Billions
Food and beverage sales, excludes food ingredients, pet and agricultural products.
Includes fruit and dairy.
PepsiCo is the world’s second largest food and beverage company.
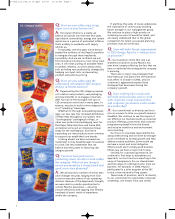
Convenience
As consumers’ lives become
more time-starved, demand
for products that offer conven-
ience continues to grow. This
“sweet spot” of convenience
features categories that have
been outgrowing the overall
food and beverage sector over
the past several years.
Our innovation pipeline is
being stoked to leverage our
growing presence in these
categories. Products such as
Quaker Oatmeal-to-Go bars
mean more people can enjoy
a heart-healthy breakfast.
With Tropicana FruitWise, a
line of fruit strips and bars
made from real fruit and
juice, we offer consumers a
delicious and portable way to
eat one to two servings of
fruit per item. Starting in
2007, consumers can choose
our breakthrough line of Flat
Earth fruit and vegetable
crisps as a convenient snack
option that provides a half
serving of fruits or vegetables
per ounce.
Our growing beverage
portfolio offers consumers
choices from regular and diet
carbonated soft drinks to
ready-to-drink teas and
coffee, waters, sports drinks,
energy drinks, and juices
and juice drinks — all in a
variety of sizes for home or
on-the-go enjoyment.
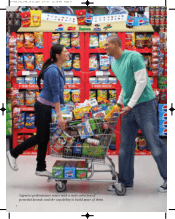
Global Operations
We are the largest savory
snack food business and the
largest sports drink producer
in the world. Our size gives us
distinct advantages. No matter
where consumers live or
travel in the world, we’re
working hard to ensure our
brands are available. Our
reach provides a competitive
edge when introducing new
products and distributing our
brands. Retailers are eager
to stock our products because
they know our brands provide
quality, variety, great taste and
move quickly off the shelves.
We have U.S. category
leadership positions — either
first or second position — in
18 categories of snacks, bever-
ages and foods. In beverages
— including carbonated plus
non-carbonated — we have
the leading market share in
the United States.
PepsiCo International has
delivered consistent growth
over the last three years, with
18 businesses now generating
revenues of at least $200
million. We have a solid share
of snacks in major markets
such as Mexico, the United
Kingdom, Brazil, Australia,
India and Russia. In developing
markets, such as China, Pepsi
50
75
100
125
150
12/200612/200512/200412/200312/200212/2001
PepsiCo Inc.
S&P 500®
S&P® Average of Industry Groups
Cumulative Total Shareholder Return
% Return on PepsiCo stock investment, the S&P 500 and the S&P Average of Industry Groups.
Shareholders purchasing PepsiCo stock at the end of 2001 and
holding it to the end of 2006 received a higher cumulative return than
the returns of the S&P 500 and our industry group.
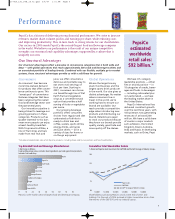
PepsiCo
estimated
worldwide
retail sales:
$92 billion.*
*Includes estimated retail sales of all PepsiCo products, including those sold by our partners and franchised bottlers.
267419_L01_P08_15.v2.qxd 3/4/07 1:01 AM Page 9