Pepsi 2006 Annual Report Download
Download and view the complete annual report
Please find the complete 2006 Pepsi annual report below. You can navigate through the pages in the report by either clicking on the pages listed below, or by using the keyword search tool below to find specific information within the annual report.-
 1
1 -
 2
2 -
 3
3 -
 4
4 -
 5
5 -
 6
6 -
 7
7 -
 8
8 -
 9
9 -
 10
10 -
 11
11 -
 12
12 -
13
-
14
-
15
-
16
-
17
-
18
-
19
-
20
-
21
-
22
-
23
-
24
-
25
-
26
-
27
-
28
-
29
-
30
-
31
-
32
-
33
-
34
-
35
-
36
-
37
-
38
-
39
-
40
-
41
-
42
-
43
-
44
-
45
-
46
-
47
-
48
-
49
-
50
-
51
-
52
-
53
-
54
-
55
-
56
-
57
-
58
-
59
-
60
-
61
-
62
-
63
-
64
-
65
-
66
-
67
-
68
-
69
-
70
-
71
-
72
-
73
-
74
-
75
-
76
-
77
-
78
-
79
-
80
-
81
-
82
-
83
-
84
-
85
-
86
 |
 |
PERFORMANCE
WITH PURPOSE
2006
Table of contents
-
Page 1
2006 PERFORMANCE WITH PURPOSE -
Page 2
...8% Quaker Foods North America Frito-Lay PepsiCo North America Beverages North America 31% 27% Frito-Lay North America 36% 2006 Summary of Operations Total net revenue Division operating profit(b) Total operating profit Net income(c) Earnings per share(c) Other Data Management operating cash flow... -
Page 3
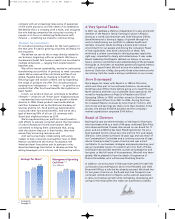
...07 11:15 PM Page 1 PepsiCo at a Glance Frito-Lay North America ($ in Millions) PepsiCo Beverages North America PepsiCo International Quaker Foods North America 2 0 0 6 Vo l u m e G ro w t h 9% 4% 1% FLNA 12000 12000 9% Beverages Snacks 1% QFNA PBNA PI Net Revenue 12000 $12,959 $11,376... -
Page 4
..., PepsiCo delivered a very strong 2006: •Volume grew 5.5%. •Net revenue grew 8%. •Division operating profit grew 7%.* •Earnings per share grew 13%.* •Total return to shareholders was 8%. •Return on invested capital was 26%.* •Cash flow from operations was $6.1 billion and management... -
Page 5
... to 2006. During this time, he increased PepsiCo revenues by more than $11 billion, and net income and earnings per share more than doubled. In the process, the annual dividend doubled and the company's market capitalization surpassed $100 billion. Board of Directors Retiring this year are three... -
Page 6
... in this publication. As a result of our efforts, the Dow Jones Sustainability North American Index - an investment fund comprised of North American companies that excel in managing economic, environmental and social results - added PepsiCo to its list in 2006. Our True North - Our Values Of course... -
Page 7
... American Heart Association and the beverage industry, are examples of working proactively to set policies that put the right kinds of products in the right locations - in this case, schools. We're working in our international markets in much the same way. An advantaged portfolio of good- and better... -
Page 8
... a strong bench and good succession planning? A: We announced a number of senior execPretzels #2 utive changes this year, ranging from CEO to senior executive talent of our operating divisions. Because of the deep bench strength, we were able to provide opportunities to current PepsiCo executives... -
Page 9
...our North American businesses. Growth internationally across a wide range of markets is strong. We believe the strong growth achieved by our PepsiCo International business in 2006 reflects the work of a world-class management team, years of investment, and the implementation of a deliberate strategy... -
Page 10
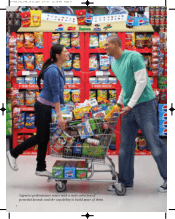
267419_L01_P08_15.v3.qxd 3/6/07 11:08 AM Page 8 Superior performance starts with a wide selection of powerful brands and the capability to build more of them. 8 -
Page 11
.... We strive to increase revenues, market share, volume, profits and earnings per share, while reducing costs and improving productivity. This, in turn, leads to strong returns for our shareholders. Our success in 2006 made PepsiCo the second-largest food and beverage company in the world. We believe... -
Page 12
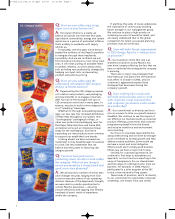
...Coca-Cola 11% All Others 57% Hershey 9% Private Label 7% Kraft Foods 12% % System Volume by Region Europe/Middle East/Africa Asia Latin America 0 6 12 18 PepsiCo is the leading convenient food and beverage company in the United States. Frito-Lay is the leading convenient snack food business in... -
Page 13
... Snack Volume % System Volume by Region Latin America 51% Asia 11% Europe/ Middle East/Africa 38% PepsiCo has the largest snack business in the world. PepsiCo International Beverage Volume % System Volume by Region Includes Pepsi-Cola, 7UP, Gatorade, Tropicana and other beverages. Europe/ Middle... -
Page 14
...juices and juice drinks, acquired in 2005. A huge opportunity awaits us in the world of non-carbonated beverages, as we currently account for less than 2% of an international non-carbonated beverage industry that we estimate to be about $70 billion and growing. PepsiCo offers a variety of products... -
Page 15
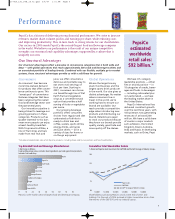
...water drinks with flavored water. In the United States, U.S. PepsiCo Beverage Distribution Channels % Volume Convenience/ Gas/Chilled DSD/ Other Small Format 17% Frito-Lay North America Distribution Channels % Volume Largest PepsiCo Brands Estimated Worldwide Retail Sales $ in Billions Pepsi-Cola... -
Page 16
... successfully add large companies, like Quaker and Tropicana, and regularly add smaller "tuck-in" deals that enhance and expand our existing operations. These include our recent acquisitions of Izze Beverage Co., Naked Juice, and Stacy's Pita Chip Company in the United States, as well as Star Foods... -
Page 17
... known by trusted brand names in each region of the world, such as Sabritas in Mexico. U.S. Liquid Refreshment Beverage Market Share % Volume in Measured Channels Other 19% PepsiCo 26% Private Label 14% Coca-Cola 23% Nestlé 8% Cadbury Schweppes 10% PepsiCo has the leading share of the liquid... -
Page 18
267419_L01_P16_21.v2.qxd 3/4/07 12:15 AM Page 16 In 2006, PepsiCo associate volunteers and KABOOM, a not-for-profit organization, built 12 playgrounds in inner cities to encourage children to be more physically active. 16 -
Page 19
...make PepsiCo the world's premier consumer products company, focused on convenient foods and beverages. We seek to produce healthy financial rewards for investors as we provide opportunities for growth and enrichment to our employees, our business partners and the communities in which we operate. And... -
Page 20
...supply. We have programs to reduce our use of water and reuse water whenever possible. Gatorade, for example, is reducing its water use by installing waterless rinsing systems to clean its bottles. We are focused on finding new opportunities to save water. For example, across Frito-Lay North America... -
Page 21
... 2006, Pepsi-Cola North America partnered with Sam's Club and KAB in an innovative program called "Return the Warmth." KAB helped PepsiCo China: four awards for Mothers' Water Cellar Project. PepsiCo: Vision for America Award from Keep America Beautiful. Frito-Lay North America: Energy Star Partner... -
Page 22
... to find work. Sustainability Time Line 1999 Frito-Lay North America begins formal resource conservation program. 2001 PepsiCo Environmental Task Force formed. 2002 Carbonated beverage packaging goal of 10% recycled content in Pepsi-Cola North America adopted. 2003 Global Reporting Initiative... -
Page 23
... Frito-Lay route sales representative in the New York City area, are the reason for PepsiCo's success. Associates Our commitment to our associates is formalized in our Human Rights Policy which was introduced in 2006. Our goal is to make PepsiCo the company that hires, develops and retains the best... -
Page 24
... Executive Vice President, Operations 45. 19 years. Clay G. Small Senior Vice President, Managing Attorney 57. 25 years. PepsiCo Latin America Region Foods & Beverages Sabritas & Gatorade Antonio Lucio Chief Health and Wellness Innovation Officer 47. 11 years. Larry D. Thompson Senior Vice... -
Page 25
... K. Nooyi. PepsiCo Board of Directors John F. Akers Former Chairman of the Board and Chief Executive Officer, International Business Machines Corporation 72. Elected 1991. Victor J. Dzau, M.D. Chancellor for Health Affairs, Duke University and President & CEO, Duke University Health Systems 61... -
Page 26
... Board Dawn Hudson President and Chief Executive Officer, Pepsi-Cola North America Joined 1999. Ray M. Robinson President, East Lake Golf Joined 1999. Keith Clinkscales Senior Vice President and General Manager, ESPN Publishing Joined 1999. Earl G. Graves, Jr. President and Chief Executive... -
Page 27
..., Proamerica Bank Joined 2005. Douglas X. Patiño, Ph.D. Vice Chancellor Emeritus and Professor, California State University Joined 2000. Albert P. Carey President and Chief Executive Officer, Frito-Lay North America Joined 2006. Isabel Valdés Consultant, Author, Public Speaker Joined 2001. 25 -
Page 28
... and policy makers in the area of health and wellness. Some of our international businesses are seeking advice in a similar manner. For example, our Brazilian business has created the PepsiCo Panel of Experts. We welcome Dr. William Sears to our Board this year. Front row, left to right: Brock... -
Page 29
...47 Frito-Lay North America ...48 PepsiCo Beverages North America...49 PepsiCo International...50 Quaker Foods North America ...51 Our Liquidity and Capital Resources...52 CONSOLIDATED STATEMENT OF INCOME ...54 CONSOLIDATED STATEMENT OF CASH FLOWS ...55 CONSOLIDATED BALANCE SHEET ...56 CONSOLIDATED... -
Page 30
... or uses contract manufacturers, markets and sells many Quaker brand snacks. PI also manufactures, markets and sells beverage concentrates, fountain syrups and ï¬nished goods under the brands Pepsi, 7UP, Mirinda, Gatorade, Tropicana and Mountain Dew. These brands are sold to authorized bottlers... -
Page 31
.... New product support includes targeted consumer and retailer incentives and direct marketplace support, such as point-of-purchase materials, product placement fees, media and advertising. Vending and cooler equipment placement programs support the acquisition and placement of vending machines and... -
Page 32
...private label manufacturers on the basis of price, quality, product variety and distribution. In measured channels, our chief beverage competitor, The Coca-Cola Company, has a slightly larger share of carbonated soft drink (CSD) consumption in the U.S., while we have a larger share of chilled juices... -
Page 33
... either to develop and launch successful including agricultural materials, packreduced demand for our products. new products or variants of existing aging, energy and water use and waste Consumer preferences may shift due to products, or to effectively execute management, or other sustainability 31 -
Page 34
... to increase the importance of major customers. Sales to Wal-Mart represent approximately 9% of our total net revenue; and our top ï¬ve retail customers currently represent approximately 26% If we are not able to build and sustain proper information technology infrastructure, our business could... -
Page 35
...snack foods, term incentive program, designed to and cardboard. Fuel and natural gas are retain talent. However, there is no also important commodities due to assurance that we will continue to be their use in our plants and in the trucks able to hire or retain key employees. delivering our products... -
Page 36
.... See "Our Critical Accounting Policies" for a discussion of the exposure of our pension plan assets and pension and retiree medical liabilities to risks related to stock prices and discount rates. Inï¬,ationary, deï¬,ationary and recessionary conditions impacting these market risks also impact the... -
Page 37
... rate gains or losses related to foreign currency transactions are recognized as transaction gains or losses in our income statement as incurred. We Stock Prices A portion of our deferred compensation liability is tied to certain market indices and our stock price. We manage these market risks... -
Page 38
... of our food safety and food security programs which helped identify opportunities to better leverage internal best practices across all of our businesses. Furthermore, we enhanced our product sampling and testing protocols. • We continued to enhance our information technology infrastructure and... -
Page 39
... retail prices. A number of our sales incentives, such as bottler funding and customer volume rebates, are based on annual targets, and accruals are established during the year for the expected payout. These accruals are based on contract terms and our historical experience with similar programs and... -
Page 40
...ï¬able assets and liabilities, including brands, based on estimated fair value, with any remaining purchase price recorded as goodwill. We believe that a brand has an indeï¬nite life if it has signiï¬cant market share in a stable macroeconomic environment and a history of strong revenue and cash... -
Page 41
.... In 2006, we recognized non-cash tax beneï¬ts of $602 million (the "2006 Tax Adjustments"), substantially all of which related to the Internal Revenue Service's (IRS) examination of our consolidated income tax returns for the years 1998 through 2002. The IRS issued a Revenue Agent's Report (RAR... -
Page 42
...years of service to earn the grant, referred to as the vesting period. Our options generally have a 10-year term, which means our employees would have up to seven years after the vesting period to elect to pay the exercise price to purchase one share of our stock for each option exercised. Employees... -
Page 43
... expected value our employees will receive from the options based on a number of assumptions, such as interest rates, employee exercises, our stock price and dividend yield. Our weightedaverage fair value assumptions include: Estimated 2007 Expected life Risk free interest rate Expected volatility... -
Page 44
... and 1) the value of beneï¬ts earned by life insurance beneï¬ts (retiree medical) employees for working during the year if they meet age and service (service cost), 2) increase in the liability requirements. Generally, our share of due to the passage of time (interest retiree medical costs is... -
Page 45
... Weighted-average assumptions for pension and retiree medical expenses are as follows: 2007 Pension Expense discount rate Expected rate of return on plan assets Expected rate of salary increases Retiree medical Expense discount rate Current health care cost trend rate 5.7% 7.7% 4.5% 5.8% 9.0% 2006... -
Page 46
... FLNA by closing two plants in the U.S., and rationalizing other assets, to increase manufacturing productivity and supply chain efficiencies. PepsiCo Share of PBG Tax Settlement In 2006, the IRS concluded its examination of PBG's consolidated income tax returns for the years 1999 through 2000 (PBG... -
Page 47
... - Consolidated Review In the discussions of net revenue and operating profit below, effective net pricing reflects the year-over-year impact of discrete pricing actions, sales incentive activities and mix resulting from selling varying products in different package sizes and in different countries... -
Page 48
...substantially offset by higher investment rates and cash balances. The tax rate increased 11.4 percentage points reï¬,ecting the $460 million AJCA tax charge, as well as the absence of income tax beneï¬ts of $266 million recorded in 2004 related to a reduction in foreign tax accruals following the... -
Page 49
... how our Chief Executive Officer monitors the performance of our divisions. For additional information on these items and our divisions, see Note 1. FLNA Net Revenue, 2006 ...Net Revenue, 2005...% Impact of: Volume ...Effective net pricing ...Foreign exchange ...Acquisitions/divestitures...% Change... -
Page 50
...Frito-Lay North America % Change 2006 Net revenue Operating proï¬t $10,844 $2,615 2005 $10,322 $2,529 2004 $9,560 $2,389 2006 5 3 2005 8 6 2006 Net revenue grew 5% reï¬,ecting volume growth of 1% and positive effective net pricing due to salty snack pricing actions and favorable mix. Pound volume... -
Page 51
...signiï¬cant impact on volume growth as bottler volume is reported based on a calendar month. Net revenue grew 5%. Positive mix contributed to the revenue growth, reï¬,ecting the strength of non-carbonated beverages. Price increases taken in 2006, primarily on concentrate, Tropicana Pure Premium and... -
Page 52
... percentage points. The acquisition of a business in Romania late in 2004 increased the Europe, Middle East & Africa region volume growth by 3 percentage points. Cumulatively, our divestiture and acquisition activities did not impact the reported total PepsiCo International snack volume growth rate... -
Page 53
... brands and innovation, as well as an unfavorable cost of sales comparison primarily due to Net revenue increased 13% and In 2006 and 2005, Smart Spot eligible products volume increased represented over half of QFNA's total net revenue. 9%. The volume increase reï¬,ects double-digit higher energy... -
Page 54
... net revenue in each of the next few years. Planned capital spending in 2007 includes increased investments at PI, particularly in the developing and emerging markets, and additional investments in manufacturing capacity to support our North American Gatorade business as well as other non-carbonated... -
Page 55
... operating cash ï¬,ow. Management operating cash ï¬,ow was used primarily to repurchase shares and pay dividends. We expect to continue to return approximately all of our management operating cash ï¬,ow to our shareholders through dividends and share repurchases. However, see "Our Business Risks... -
Page 56
267419_L01_P27_81.v2.qxd 2/28/07 4:08 PM Page 54 Consolidated Statement of Income PepsiCo, Inc. and Subsidiaries Fiscal years ended December 30, 2006, December 31, 2005 and December 25, 2004 (in millions except per share amounts) 2006 $35,137 15,762 12,774 162 - 6,439 616 (239) 173 6,989 1,347 ... -
Page 57
... and retiree medical plan expenses ...Bottling equity income, net of dividends...Deferred income taxes and other tax charges and credits...Other non-cash charges and credits, net...Change in accounts and notes receivable ...Change in inventories...Change in prepaid expenses and other current assets... -
Page 58
... PM Page 56 Consolidated Balance Sheet PepsiCo, Inc. and Subsidiaries December 30, 2006 and December 31, 2005 (in millions except per share amounts) 2006 2005 ASSETS Current Assets Cash and cash equivalents ...Short-term investments ...Accounts and notes receivable, net...Inventories ...Prepaid... -
Page 59
...246) Shares 1,782 Common Stock ...1,782 Capital in Excess of Par Value Balance, beginning of year ...Stock-based compensation expense...Stock option exercises(a) ...Balance, end of year...Retained Earnings Balance, beginning of year ...Net income...Cash dividends declared - common...Cash dividends... -
Page 60
... prior years' amounts to conform to the 2006 presentation. Our Divisions We manufacture or use contract manufacturers, market and sell a variety of salty, sweet and grain-based snacks, carbonated and non-carbonated beverages, and foods through our North American and international business divisions... -
Page 61
....qxd 2/28/07 4:09 PM Page 59 Frito-Lay North America (FLNA) PepsiCo Beverages North America (PBNA) PepsiCo International (PI) Quaker Foods North America (QFNA) Net Revenue 2006 FLNA PBNA PI QFNA Total division Corporate Restructuring and impairment charges Total $10,844 9,565 12,959 1,769 35... -
Page 62
...on bad debts, see "Our Critical Accounting Policies" in Management's Discussion and Analysis. We are exposed to concentration of credit risk by our customers, Wal-Mart and PBG. In 2006, Wal-Mart represented approximately 9% of our total net revenue, including concentrate sales to our bottlers which... -
Page 63
... in property, plant and equipment on our balance sheet and amortized on a straight-line basis when placed into service over the estimated useful lives of the software, which approximate ï¬ve to seven years. Net capitalized software and development costs were $537 million at December 30, 2006 and... -
Page 64
... Charges In 2006, we incurred a charge of $67 million ($43 million after-tax or $0.03 per share) in conjunction with consolidating the manufacturing network at FLNA by closing two plants in the U.S., and rationalizing other assets, to increase manufacturing productivity and supply chain efficiencies... -
Page 65
... value of nonamortizable intangible assets is as follows: Balance, Beginning 2005 Acquisitions Frito-Lay North America Goodwill PepsiCo Beverages North America Goodwill Brands PepsiCo International Goodwill Brands Quaker Foods North America Goodwill Corporate Pension intangible Total goodwill Total... -
Page 66
... ...Lower taxes on foreign results...Settlement of prior years' audit...2006 Tax Adjustments...Other, net ...Annual tax rate ...Deferred tax liabilities Investments in noncontrolled affiliates...Property, plant and equipment...Pension beneï¬ts...Intangible assets other than nondeductible goodwill... -
Page 67
... the public offering of PBG, as well as the restructuring of our international snack foods operations during that audit period. During 2004, we recognized $266 million of tax beneï¬ts related to the Undistributed International Earnings The AJCA created a one-time incentive for U.S. corporations to... -
Page 68
... to adoption, such excess tax beneï¬ts were reported as an operating cash inï¬,ow. Our weighted-average Black-Scholes fair value assumptions are as follows: 2006 Expected life Risk free interest rate Expected volatility Expected dividend yield 6 yrs. 4.5% 18% 1.9% 2005 6 yrs. 3.8% 23% 1.8% 2004... -
Page 69
... Retiree Medical and Savings Plans Our pension plans cover full-time employees in the U.S. and certain international employees. Beneï¬ts are determined based on either years of service or a combination of years of service and earnings. U.S. and Canada retirees are also eligible for medical and life... -
Page 70
... Actual asset return different from expected return (122) (133) Amortization of losses (164) (106) Other, including foreign currency adjustments and 2003 Medicare Act (3) (3) Total $ (452) $(275) Liability at end of year for service to date 68 Retiree Medical 2006 International 2005 2006 2005 2005... -
Page 71
...Fair value of plan assets 2005 2006 International 2005 Retiree Medical 2006 2005 $(387) $1 $(374) $8 $(286) $237 $(65) $33 $(754) $1 $(2,690) $1,758 $(1,387) $1,200 $(1,158) $985 $(1,370) - $(1,312) - Of the total projected pension beneï¬t liability at year-end 2006, $701 million relates... -
Page 72
...stock with a market value of $358 million in 2006, and 5.5 million shares with a market value of $311 million in 2005. Our investment policy limits the investment in PepsiCo stock at the time of investment to 10% of the fair value of plan assets. Retiree Medical Cost Trend Rates An average increase... -
Page 73
... their net assets at year-end 2006 and 2005, respectively. Based upon the quoted closing price of PBG shares at year-end 2006 and 2005, the calculated market value of our shares in PBG, excluding our investment in Bottling Group, LLC, exceeded our investment balance by approximately $1.4 billion and... -
Page 74
... in our consolidated ï¬nancial statements as follows: 2006 Net revenue $4,837 Selling, general and administrative expenses $87 Accounts and notes receivable $175 Accounts payable and other current liabilities $62 Such amounts are settled on terms consistent with other trade receivables and payables... -
Page 75
... rates, • stock prices, and • discount rates affecting the measurement of our pension and retiree medical liabilities. In the normal course of business, we manage these risks through a variety of strategies, including the use of derivatives. Certain derivatives are designated as either cash... -
Page 76
... million related to cash ï¬,ow hedges from accumulated other comprehensive loss into net income. Derivatives used to hedge commodity price risks that do not qualify for hedge accounting are marked to market each period and reï¬,ected in our income statement. Foreign Exchange Our operations outside... -
Page 77
...Net income available for common shareholders Basic net income per common share Net income available for common shareholders Dilutive securities: Stock options and RSUs ESOP convertible preferred stock Diluted Diluted net income per common share (a) Weighted-average common shares outstanding. $5,642... -
Page 78
... recognition into our income statement. Accumulated other comprehensive loss is separately presented on our balance sheet as part of common shareholders' equity. Other comprehensive 2006 Currency translation adjustment Cash ï¬,ow hedges, net of tax(a) Unamortized pension and retiree medical, net of... -
Page 79
... was computed using the LIFO method. The differences between LIFO and FIFO methods of valuing these inventories were not material. 2006 Other assets Non-current notes and accounts receivable Deferred marketplace spending Unallocated purchase price for recent acquisitions Pension plans Other $149... -
Page 80
... of the Board of Directors has engaged independent registered public accounting ï¬rm, KPMG LLP, to audit our consolidated ï¬nancial statements and they have expressed an unqualiï¬ed opinion. We are committed to providing timely, accurate and understandable information to investors. Our commitment... -
Page 81
...for establishing and maintaining adequate internal control over ï¬nancial reporting, as such term is deï¬ned in Rule 13a-15(f) of the Exchange Act. Under the supervision and with the participation of our management, including our Chief Executive Officer and Chief Financial Officer, we conducted an... -
Page 82
... Public Accounting Firm Board of Directors and Shareholders PepsiCo, Inc.: We have audited the accompanying Consolidated Balance Sheet of PepsiCo, Inc. and Subsidiaries as of December 30, 2006 and December 31, 2005 and the related Consolidated Statements of Income, Cash Flows and Common Shareholders... -
Page 83
... $2,313 $2,397 30.4% 22.7% 27.4% Return on invested capital(a) Five-Year Summary (Cont.) Net revenue Net income Income per common share - basic Income per common share - diluted Cash dividends declared per common share Total assets Long-term debt Return on invested capital(a) 2003 2002 $26,971 $25... -
Page 84
... CSD: carbonated soft drinks. Derivatives: ï¬nancial instruments that we use to manage our risk arising from changes in commodity prices, interest rates, foreign exchange rates and stock prices. Direct-Store-Delivery (DSD): delivery system used by us and our bottlers to deliver snacks and beverages... -
Page 85
... merger of Pepsi-Cola Company and Frito-Lay, Inc. A $1,000 investment in our stock made on December 31, 2001 was worth about $1,393 on December 31, 2006, assuming the reinvestment of dividends into PepsiCo stock. This performance represents a compounded annual growth rate of 7%. The closing price... -
Page 86