Pep Boys 2013 Annual Report Download - page 91
Download and view the complete annual report
Please find page 91 of the 2013 Pep Boys annual report below. You can navigate through the pages in the report by either clicking on the pages listed below, or by using the keyword search tool below to find specific information within the annual report.-
 1
1 -
2
-
3
-
4
-
5
-
6
-
7
-
8
-
9
-
10
-
11
-
12
-
13
-
14
-
15
-
16
-
17
-
18
-
19
-
20
-
21
-
22
-
23
-
24
-
25
-
26
-
27
-
28
-
29
-
30
-
31
-
32
-
33
-
34
-
35
-
36
-
37
-
38
-
39
-
40
-
41
-
42
-
43
-
44
-
45
-
46
-
47
-
48
-
49
-
50
-
51
-
52
-
53
-
54
-
55
-
56
-
57
-
58
-
59
-
60
-
61
-
62
-
63
-
64
-
65
-
66
-
67
-
68
-
69
-
70
-
71
-
72
-
73
-
74
-
75
-
76
-
77
-
78
-
79
-
80
-
 81
81 -
 82
82 -
 83
83 -
 84
84 -
 85
85 -
 86
86 -
 87
87 -
 88
88 -
 89
89 -
 90
90 -
 91
91 -
 92
92 -
 93
93 -
 94
94 -
 95
95 -
 96
96 -
 97
97 -
 98
98 -
 99
99 -
 100
100 -
 101
101 -
102
-
103
-
104
-
105
-
106
-
107
-
108
-
109
-
110
-
111
-
112
-
113
-
114
-
115
-
116
-
117
-
118
-
119
-
120
-
121
-
122
-
123
-
124
-
125
-
126
-
127
-
128
-
129
-
130
-
131
-
132
-
133
-
134
-
135
-
136
-
137
-
138
-
139
-
140
-
141
-
142
-
143
-
144
-
145
-
146
-
147
-
148
-
149
-
150
-
151
-
152
-
153
-
154
-
155
-
156
-
157
-
158
-
159
-
160
-
161
-
162
-
163
-
164
 |
 |
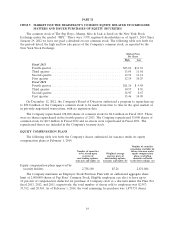
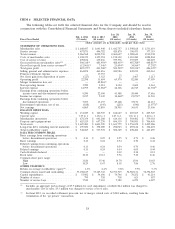
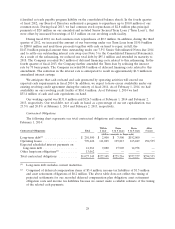
(3) Includes an aggregate pretax charge of $10.6 million for asset impairment, of which $5.1 million was charged to
merchandise cost of sales, $5.5 million was charged to service cost of sales.
(4) Includes $11.2 million of fees associated with debt refinancing.
(5) Includes an aggregate pretax charge of $1.6 million for asset impairment, of which $0.6 million was charged to
merchandise cost of sales, $1.0 million was charged to service cost of sales.
(6) Includes a tax benefit of $3.6 million and $2.2 million in Fiscal 2011 and Fiscal 2010, respectively, due to the release
of valuation allowances on state net operating loss carryforwards and credits.
(7) Includes a pretax benefit of $5.9 million due to the reduction in reserve for excess inventory which reduced
merchandise cost of sales and an aggregate pretax charge of $1.0 million for asset impairment, of which $0.8 million
was charged to merchandise cost of sales and $0.2 million was charged to service cost of sales.
(8) Includes an aggregate pretax charge of $3.1 million for asset impairment, of which $2.2 million was charged to
merchandise cost of sales, $0.7 million was charged to service cost of sales and $0.2 million (pretax) was charged to
discontinued operations.
(9) Includes a gain from debt retirement of $6.2 million.
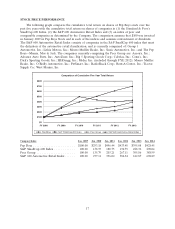
(10) Gross profit from merchandise sales includes the cost of products sold, buying, warehousing and store occupancy
costs. Gross profit from service revenue includes the cost of installed products sold, buying, warehousing, service
payroll and related employee benefits and occupancy costs. Occupancy costs include utilities, rents, real estate and
property taxes, repairs and maintenance and depreciation and amortization expenses. Our gross profit may not be
comparable to those of our competitors due to differences in industry practice regarding the classification of certain
costs.
(11) Return on average stockholders’ equity is calculated by dividing net earnings (loss) for the period by average
stockholders’ equity for the year.
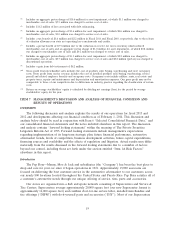
ITEM 7 MANAGEMENT’S DISCUSSION AND ANALYSIS OF FINANCIAL CONDITION AND
RESULTS OF OPERATIONS
OVERVIEW
The following discussion and analysis explains the results of our operations for fiscal 2013 and
2012 and developments affecting our financial condition as of February 1, 2014. This discussion and
analysis below should be read in conjunction with Item 6 ‘‘Selected Consolidated Financial Data,’’ and
our consolidated financial statements and the notes included elsewhere in this report. The discussion
and analysis contains ‘‘forward looking statements’’ within the meaning of The Private Securities
Litigation Reform Act of 1995. Forward looking statements include management’s expectations
regarding implementation of its long-term strategic plan, future financial performance, automotive
aftermarket trends, levels of competition, business development activities, future capital expenditures,
financing sources and availability and the effects of regulation and litigation. Actual results may differ
materially from the results discussed in the forward looking statements due to a number of factors
beyond our control, including those set forth under the section entitled ‘‘Item 1A Risk Factors’’
elsewhere in this report.
Introduction
The Pep Boys—Manny, Moe & Jack and subsidiaries (the ‘‘Company’’) has been the best place to
shop and care for your car since it began operations in 1921. Approximately 19,000 associates are
focused on delivering the best customer service in the automotive aftermarket to our customers across
our nearly 800 locations located throughout the United States and Puerto Rico. Pep Boys satisfies all of
a customer’s automotive needs through our unique offering of service, tires, parts and accessories.
Our stores are organized into a hub and spoke network consisting of Supercenters and Service &
Tire Centers. Supercenters average approximately 20,000 square feet (our new Supercenter format is
approximately 14,000 square feet) and combine do-it-for-me service labor, installed merchandise and
tire offerings (‘‘DIFM’’) with do-it-yourself parts and accessories (‘‘DIY’’). Most of our Supercenters
19