Pep Boys 2013 Annual Report Download - page 112
Download and view the complete annual report
Please find page 112 of the 2013 Pep Boys annual report below. You can navigate through the pages in the report by either clicking on the pages listed below, or by using the keyword search tool below to find specific information within the annual report.-
 1
1 -
2
-
3
-
4
-
5
-
6
-
7
-
8
-
9
-
10
-
11
-
12
-
13
-
14
-
15
-
16
-
17
-
18
-
19
-
20
-
21
-
22
-
23
-
24
-
25
-
26
-
27
-
28
-
29
-
30
-
31
-
32
-
33
-
34
-
35
-
36
-
37
-
38
-
39
-
40
-
41
-
42
-
43
-
44
-
45
-
46
-
47
-
48
-
49
-
50
-
51
-
52
-
53
-
54
-
55
-
56
-
57
-
58
-
59
-
60
-
61
-
62
-
63
-
64
-
65
-
66
-
67
-
68
-
69
-
70
-
71
-
72
-
73
-
74
-
75
-
76
-
77
-
78
-
79
-
80
-
81
-
82
-
83
-
84
-
85
-
86
-
87
-
88
-
89
-
90
-
91
-
92
-
93
-
94
-
95
-
96
-
97
-
98
-
99
-
100
-
101
-
 102
102 -
 103
103 -
 104
104 -
 105
105 -
 106
106 -
 107
107 -
 108
108 -
 109
109 -
 110
110 -
 111
111 -
 112
112 -
 113
113 -
 114
114 -
 115
115 -
 116
116 -
 117
117 -
 118
118 -
 119
119 -
 120
120 -
 121
121 -
 122
122 -
123
-
124
-
125
-
126
-
127
-
128
-
129
-
130
-
131
-
132
-
133
-
134
-
135
-
136
-
137
-
138
-
139
-
140
-
141
-
142
-
143
-
144
-
145
-
146
-
147
-
148
-
149
-
150
-
151
-
152
-
153
-
154
-
155
-
156
-
157
-
158
-
159
-
160
-
161
-
162
-
163
-
164
 |
 |

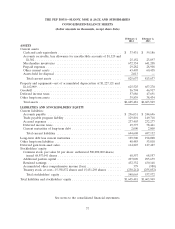
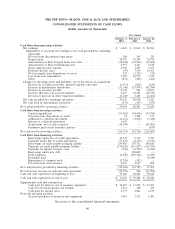
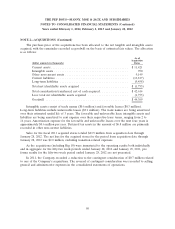
THE PEP BOYS—MANNY, MOE & JACK AND SUBSIDIARIES
CONSOLIDATED STATEMENTS OF CASH FLOWS
(dollar amounts in thousands)
Year Ended
February 1, February 2, January 28,
2014 2013 2012
Cash flows from operating activities:
Net earnings ............................................. $ 6,865 $ 12,810 $ 28,903
Adjustments to reconcile net earnings to net cash provided by continuing
operations:
Net loss from discontinued operations ........................ 188 345 225
Depreciation ......................................... 78,439 79,104 79,390
Amortization of deferred gain from asset sales .................. (12,604) (12,846) (12,602)
Amortization of deferred financing costs ...................... 2,993 4,431 2,538
Stock compensation expense ............................... 2,992 1,299 3,237
Deferred income taxes ................................... (79) 7,576 10,301
Net loss (gain) from dispositions of assets ...................... 227 (1,323) (27)
Loss from asset impairment ............................... 7,659 10,555 1,619
Other .............................................. (493) (269) (421)
Changes in operating assets and liabilities, net of the effects of acquisitions:
Increase in accounts receivable, prepaid expenses and other ......... (6,511) (602) (147)
Increase in merchandise inventories .......................... (31,146) (27,074) (42,756)
Increase in accounts payable ............................... 8,378 984 24,871
Increase (decrease) in accrued expenses ....................... 6,115 10,481 (18,745)
(Decrease) increase in other long-term liabilities ................. (3,345) 3,487 (2,463)
Net cash provided by continuing operations ....................... 59,678 88,958 73,923
Net cash used in discontinued operations ......................... (274) (467) (273)
Net cash provided by operating activities ........................... 59,404 88,491 73,650
Cash flows from investing activities:
Capital expenditures .................................... (53,982) (54,696) (74,746)
Proceeds from dispositions of assets .......................... 21 5,588 515
Additions to collateral investment ........................... (2,312) (3,654) (7,638)
Release of collateral investment ............................ 1,650 — —
Acquisitions, net of cash acquired. .......................... (10,694) — (42,901)
Premiums paid on life insurance policies ...................... — — (837)
Net cash used in investing activities ............................... (65,317) (52,762) (125,607)
Cash flows from financing activities:
Borrowings under line of credit agreements .................... 40,745 2,319 5,721
Payments under line of credit agreements ...................... (37,245) (2,319) (5,721)
Borrowings on trade payable program liability ................... 154,985 179,751 144,180
Payments on trade payable program liability .................... (174,902) (115,247) (115,253)
Payments for finance issuance costs .......................... (770) (6,520) (2,441)
Borrowings under new debt ............................... — 200,000 —
Debt payments ........................................ (2,000) (295,122) (1,079)
Dividends paid ........................................ — — (6,344)
Repurchase of common stock .............................. (2,750) (342) —
Proceeds from stock issuance .............................. 2,095 2,693 898
Net cash (used in) provided by financing activities ..................... (19,842) (34,787) 19,961
Net (decrease) increase in cash and cash equivalents ................... (25,755) 942 (31,996)
Cash and cash equivalents at beginning of year ....................... 59,186 58,244 90,240
Cash and cash equivalents at end of year ........................... $ 33,431 $ 59,186 $ 58,244
Supplemental cash flow information:
Cash paid for interest, net of amounts capitalized ................ $ 12,027 $ 31,290 $ 23,097
Cash received from income tax refunds ....................... 1,251 108 479
Cash paid for income taxes ................................ 4,377 2,826 1,150
Non-cash investing activities:
Accrued purchases of property and equipment .................. 3,467 1,371 1,400
See notes to the consolidated financial statements.
40