Pep Boys 2012 Annual Report Download - page 71
Download and view the complete annual report
Please find page 71 of the 2012 Pep Boys annual report below. You can navigate through the pages in the report by either clicking on the pages listed below, or by using the keyword search tool below to find specific information within the annual report.-
 1
1 -
2
-
3
-
4
-
5
-
6
-
7
-
8
-
9
-
10
-
11
-
12
-
13
-
14
-
15
-
16
-
17
-
18
-
19
-
20
-
21
-
22
-
23
-
24
-
25
-
26
-
27
-
28
-
29
-
30
-
31
-
32
-
33
-
34
-
35
-
36
-
37
-
38
-
39
-
40
-
41
-
42
-
43
-
44
-
45
-
46
-
47
-
48
-
49
-
50
-
51
-
52
-
53
-
54
-
55
-
56
-
57
-
58
-
59
-
60
-
 61
61 -
 62
62 -
 63
63 -
 64
64 -
 65
65 -
 66
66 -
 67
67 -
 68
68 -
 69
69 -
 70
70 -
 71
71 -
 72
72 -
 73
73 -
 74
74 -
 75
75 -
 76
76 -
 77
77 -
 78
78 -
 79
79 -
 80
80 -
 81
81 -
82
-
83
-
84
-
85
-
86
-
87
-
88
-
89
-
90
-
91
-
92
-
93
-
94
-
95
-
96
-
97
-
98
-
99
-
100
-
101
-
102
-
103
-
104
-
105
-
106
-
107
-
108
-
109
-
110
-
111
-
112
-
113
-
114
-
115
-
116
-
117
-
118
-
119
-
120
-
121
-
122
-
123
-
124
-
125
-
126
-
127
-
128
-
129
-
130
-
131
 |
 |
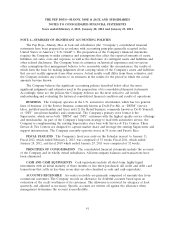
• We record reserves for future sales returns, customer incentives, warranty claims and inventory
shrinkage. The reserves are based on expected returns of products and historical claims and
inventory shrinkage experience. If actual experience differs from historical levels, revisions in our
estimates may be required. A 10% change in these reserves at February 2, 2013 would have
affected net earnings by approximately $0.8 million for fiscal 2012.
• We have risk participation arrangements with respect to workers’ compensation, general liability,
automobile liability, other casualty coverage and health care insurance, including stop loss
coverage with third party insurers to limit our total exposure. A reserve for the liabilities
associated with these agreements is established using generally accepted actuarial methods
followed in the insurance industry and our historical claims experience. The amounts included in
our costs related to these arrangements are estimated and can vary based on changes in
assumptions, claims experience or the providers included in the associated insurance programs.
A 10% change in our self-insurance liabilities at February 2, 2013 would have affected net
earnings by approximately $4.2 million for fiscal 2012.
• At fiscal year end 2012, we had six reporting units, of which three included goodwill. We test the
recorded amount of goodwill for recovery on an annual basis in the fourth quarter of each fiscal
year. More frequent impairment reviews may be triggered by any significant events or changes in
circumstances affecting our business.
Goodwill impairment testing consists of a two-step process, if necessary. The first step is to
compare the fair value of a reporting unit with its carrying amount. If the carrying amount of a
reporting unit exceeds its fair value, the second step of the impairment test must be performed
in order to determine the amount of impairment loss, if any. The second step compares the
implied fair value of reporting unit goodwill with the carrying amount of that goodwill. If the
carrying amount of reporting unit goodwill exceeds the implied fair value of that goodwill, an
impairment loss is recognized in an amount equal to the excess. The loss recognized cannot
exceed the carrying amount of goodwill. The implied fair value of goodwill is determined in the
same manner that the amount of goodwill recognized in a business combination is determined.
We allocate the fair value of a reporting unit to all of the assets and liabilities of that unit,
including intangible assets. Any excess of the value of a reporting unit over the amounts
assigned to its assets and liabilities is the implied fair value of goodwill. A deterioration of
macroeconomic conditions may not only negatively impact the estimated operating cash flows
used in our cash flow models, but may also negatively impact other assumptions used in our
analyses, including, but not limited to, the estimated cost of capital and/or discount rates.
Additionally, in accordance with accounting guidance, we are required to ensure that
assumptions used to determine fair value in the analyses are consistent with the assumptions a
market participant would use. As a result, the cost of capital and/or discount rates used may
increase or decrease based on market conditions and trends, regardless of whether our cost of
capital has changed. Therefore we may recognize an impairment even though cash flows are
approximately the same or greater than forecasted amounts.
There were no impairments as a result of our annual tests in the fourth quarter of fiscal year
2012, fiscal year 2011, and fiscal year 2010.
• We periodically evaluate our long-lived assets for indicators of impairment. Management’s
judgments, including judgments related to store cash flows, are based on market and operating
conditions at the time of evaluation. Future events could cause management’s conclusion on
impairment to change, requiring an adjustment of these assets to their then current fair market
value.
• We have a share-based compensation plan, which includes stock options and restricted stock
units, or RSUs. We account for our share-based compensation plans on a fair value basis. We
32