Pep Boys 2008 Annual Report Download - page 90
Download and view the complete annual report
Please find page 90 of the 2008 Pep Boys annual report below. You can navigate through the pages in the report by either clicking on the pages listed below, or by using the keyword search tool below to find specific information within the annual report.-
 1
1 -
2
-
3
-
4
-
5
-
6
-
7
-
8
-
9
-
10
-
11
-
12
-
13
-
14
-
15
-
16
-
17
-
18
-
19
-
20
-
21
-
22
-
23
-
24
-
25
-
26
-
27
-
28
-
29
-
30
-
31
-
32
-
33
-
34
-
35
-
36
-
37
-
38
-
39
-
40
-
41
-
42
-
43
-
44
-
45
-
46
-
47
-
48
-
49
-
50
-
51
-
52
-
53
-
54
-
55
-
56
-
57
-
58
-
59
-
60
-
61
-
62
-
63
-
64
-
65
-
66
-
67
-
68
-
69
-
70
-
71
-
72
-
73
-
74
-
75
-
76
-
77
-
78
-
79
-
 80
80 -
 81
81 -
 82
82 -
 83
83 -
 84
84 -
 85
85 -
 86
86 -
 87
87 -
 88
88 -
 89
89 -
 90
90 -
 91
91 -
 92
92 -
 93
93 -
 94
94 -
 95
95 -
 96
96 -
 97
97 -
 98
98 -
 99
99 -
 100
100 -
101
-
102
-
103
-
104
-
105
-
106
-
107
-
108
-
109
-
110
-
111
-
112
-
113
-
114
-
115
-
116
-
117
-
118
-
119
-
120
-
121
-
122
-
123
-
124
-
125
-
126
-
127
-
128
-
129
-
130
-
131
-
132
-
133
-
134
-
135
-
136
-
137
-
138
-
139
-
140
-
141
-
142
-
143
-
144
-
145
-
146
-
147
-
148
-
149
-
150
-
151
-
152
-
153
-
154
-
155
-
156
-
157
-
158
-
159
-
160
-
161
-
162
-
163
-
164
-
165
-
166
-
167
-
168
 |
 |
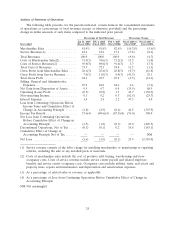
44.4% and warehousing costs declined by 16 basis points to 4.0% of merchandise sales. These
improvements were partially offset by increased occupancy costs of 90 basis points as a result of
increased rental obligations stemming from the sale-leaseback transactions.
Gross profit from service revenue declined as a percentage of service revenue to 7.0% in fiscal
year 2008 from 11.0% in fiscal year 2007. Gross profit dollars from service revenue declined by 41.5%
in fiscal year 2008 or $17,681,000 from fiscal year 2007. The prior year included a $1,849,000 asset
impairment charge related to the closure of 20 closed stores while the current year included an
additional asset impairment charge of $648,000. Excluding these adjustments, gross profit from service
revenue declined by $18,882,000. As a percentage of service revenues, gross margin declined from
11.4% in the prior year to 7.1% in fiscal year 2008 primarily due to a $30,373,000 decline in service
revenue as discussed above and higher workers compensation expense, partly offset by lower service
payroll and related expenses. The decline in sales volume resulted in reduced leverage of fixed
expenses such as occupancy costs and to a certain extent labor costs.
Selling, general and administrative expenses, as a percentage of total revenues, increased to 25.2%
for fiscal year 2008 as compared to 24.2% for fiscal year 2007, however total selling general and
administrative expenses declined by $33,329,000 or 6.4% over the prior year. This decrease in dollars
was the result of expense control initiatives, with major reductions in compensation and compensation
related benefits of $29,377,000 and lower media expense of $4,776,000 as compared to the same period
in the prior year.
Net gain from disposition of assets decreased, as a percentage of total revenue, to 0.5% for fiscal
year 2008 as compared to 0.7% for fiscal year 2007. The $5,435,000 decrease resulted from the decline
in the immediate recognition of gain on the sale leaseback transactions that were completed in the
prior year as compared to those completed in the current year.
Interest expense decreased $24,245,000 or 47.3% to $27,048,000 in fiscal year 2008 from
$51,293,000 in fiscal year 2007 primarily due to reduced debt levels as a result of applying proceeds
from our sale leaseback transactions. Included in fiscal 2008 are a gain of $3,460,000 due to debt
repurchases and a $1,172,000 charge for deferred financing costs related to our previous credit facility.
Fiscal year 2007 includes a $5,900,000 charge for deferred financing costs resulting from the repayment
of $162,558,000 of our Senior Secured Term Loan facility and the reclassification from other
comprehensive loss for the portion of the related interest rate swap that is no longer designated as a
hedge. Excluding these adjustments, interest expense declined by $16,057,000 or 35.4%.
Non-operating income as a percentage of total revenues decreased from 0.2% in fiscal year 2007
to 0.1% in fiscal year 2008. This decrease of $3,279,000 was due to lower investment balances in fiscal
year 2008 as compared to fiscal year 2007.
Loss from discontinued operations was $1,591,000 in fiscal year 2008 versus $3,601,000, in fiscal
year 2007. Fiscal years 2008 and 2007 included impairment charges of $1,926,000 and $3,764,000,
respectively due to 11 store closures in the fourth quarter of fiscal year 2007.
Our income tax benefit as a percentage of loss from continuing operations before income taxes
was 17.6% or $6,139,000 for fiscal 2008 versus 40.6% or $25,594,000 for fiscal year 2007. The decline in
the effective rate was due to the non-deductibility of certain expenses for tax purposes, the recognition
of a gain for tax on the surrender of life insurance policies and the establishment of a valuation
allowance on certain state net operating losses and credits.
As a result of the foregoing, our net loss decreased by $10,610,000 in fiscal year 2008 to
$30,429,000 from $41,039,000 in fiscal year 2007. The Company’s basic and diluted loss per share
improved $0.21 per share in fiscal year 2008 to a loss of $0.58 per share versus a loss of $0.79 per share
in fiscal year 2007.
26