PNC Bank 2005 Annual Report Download - page 89
Download and view the complete annual report
Please find page 89 of the 2005 PNC Bank annual report below. You can navigate through the pages in the report by either clicking on the pages listed below, or by using the keyword search tool below to find specific information within the annual report.-
 1
1 -
2
-
3
-
4
-
5
-
6
-
7
-
8
-
9
-
10
-
11
-
12
-
13
-
14
-
15
-
16
-
17
-
18
-
19
-
20
-
21
-
22
-
23
-
24
-
25
-
26
-
27
-
28
-
29
-
30
-
31
-
32
-
33
-
34
-
35
-
36
-
37
-
38
-
39
-
40
-
41
-
42
-
43
-
44
-
45
-
46
-
47
-
48
-
49
-
50
-
51
-
52
-
53
-
54
-
55
-
56
-
57
-
58
-
59
-
60
-
61
-
62
-
63
-
64
-
65
-
66
-
67
-
68
-
69
-
70
-
71
-
72
-
73
-
74
-
75
-
76
-
77
-
78
-
 79
79 -
 80
80 -
 81
81 -
 82
82 -
 83
83 -
 84
84 -
 85
85 -
 86
86 -
 87
87 -
 88
88 -
 89
89 -
 90
90 -
 91
91 -
 92
92 -
 93
93 -
 94
94 -
 95
95 -
 96
96 -
 97
97 -
 98
98 -
 99
99 -
100
-
101
-
102
-
103
-
104
-
105
-
106
-
107
-
108
-
109
-
110
-
111
-
112
-
113
-
114
-
115
-
116
-
117
-
118
-
119
-
120
-
121
-
122
-
123
-
124
-
125
-
126
-
127
-
128
-
129
-
130
-
131
-
132
-
133
-
134
-
135
-
136
-
137
-
138
-
139
-
140
-
141
-
142
-
143
-
144
-
145
-
146
-
147
-
148
-
149
-
150
-
151
-
152
-
153
-
154
-
155
-
156
-
157
-
158
-
159
-
160
-
161
-
162
-
163
-
164
-
165
-
166
-
167
-
168
-
169
-
170
-
171
-
172
-
173
-
174
-
175
-
176
-
177
-
178
-
179
-
180
-
181
-
182
-
183
-
184
-
185
-
186
-
187
-
188
-
189
-
190
-
191
-
192
-
193
-
194
-
195
-
196
-
197
-
198
-
199
-
200
-
201
-
202
-
203
-
204
-
205
-
206
-
207
-
208
-
209
-
210
-
211
-
212
-
213
-
214
-
215
-
216
-
217
-
218
-
219
-
220
-
221
-
222
-
223
-
224
-
225
-
226
-
227
-
228
-
229
-
230
-
231
-
232
-
233
-
234
-
235
-
236
-
237
-
238
-
239
-
240
-
241
-
242
-
243
-
244
-
245
-
246
-
247
-
248
-
249
-
250
-
251
-
252
-
253
-
254
-
255
-
256
-
257
-
258
-
259
-
260
-
261
-
262
-
263
-
264
-
265
-
266
-
267
-
268
-
269
-
270
-
271
-
272
-
273
-
274
-
275
-
276
-
277
-
278
-
279
-
280
-
281
-
282
-
283
-
284
-
285
-
286
-
287
-
288
-
289
-
290
-
291
-
292
-
293
-
294
-
295
-
296
-
297
-
298
-
299
-
300
 |
 |

89
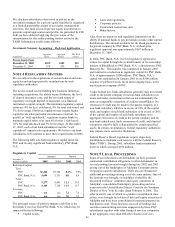
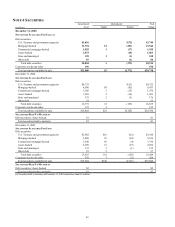
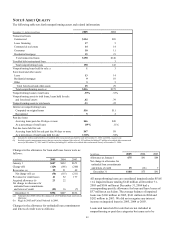
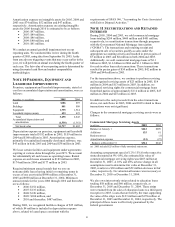
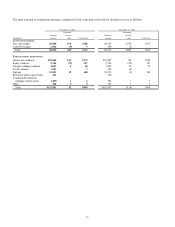
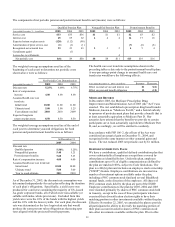
NOTE 8 ASSET QUALITY
The following table sets forth nonperforming assets and related information:
December 31 - dollars in millions 2005 2004
Nonaccrual loans
Commercial $134 $89
Lease financing 17 5
Commercial real estate 14 14
Consumer 10 11
Residential mortgage 15 21
Total nonaccrual loans $190 $140
Troubled debt restructured loan 3
Total nonperforming loans 190 143
Nonperforming loans held for sale (a) 1 3
Foreclosed and other assets
Lease 13 14
Residential mortgage 9 10
Other 3 5
Total foreclosed and other assets
25
29
Total nonperforming assets
(b)
$216
$175
Nonperforming loans to total loans .39% .33%
Nonperforming assets to total loans, loans held for sale
and foreclosed assets .42 .39
Nonperforming assets to total assets .23 .22
Interest on nonperforming loans
Computed on original terms $16 $11
Recognized 5 2
Past due loans
Accruing loans past due 90 days or more $46 $49
As a percentage of total loans .09% .11%
Past due loans held for sale
Accruing loans held for sale past due 90 days or more $47 $9
As a percentage of total loans held for sale 1.92% .54%
(a) Includes $1 million and $2 million of troubled debt restructured loans held for sale at December 31, 2005 and 2004, respectively.
(b) Excludes equity management assets that are carried at estimated fair value of $25 million (including $7 million of troubled debt restructured
assets) at December 31, 2005 and $32 million (including $11 million of troubled debt restructured assets) at December 31, 2004.
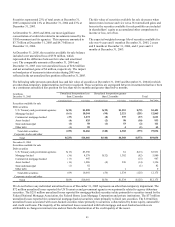
Changes in the allowance for loan and lease losses were as
follows:
In millions 2005
2004 2003
January 1 $607
$632 $673
Charge-offs (129)
(166) (260)
Recoveries (a) 99
51 49
Net charge-offs (a) (30)
(115) (211)
Provision for credit losses 21
52 177
Acquired allowance (b) 23 22
Net change in allowance for
unfunded loan commitments
and letters of credit (25)
16 (7)
December 31 $596
$607 $632
(a) Amounts for 2005 reflect the impact of a $53 million loan recovery in
that year.
(b) Riggs in 2005 and United National in 2004.
Changes in the allowance for unfunded loan commitments
and letters of credit were as follows:
In millions 2005 2004 2003
Allowance at January 1 $75 $91 $84
Net change in allowance for
unfunded loan commitments
and letters of credit 25 (16)
7
December 31 $100 $75 $91
All nonperforming loans are considered impaired under SFAS
114. Impaired loans totaling $148 million at December 31,
2005 and $106 million at December 31, 2004 had a
corresponding specific allowance for loan and lease losses of
$37 million at each date. The average balance of impaired
loans was $106 million in 2005, $141 million in 2004 and
$282 million in 2003. We did not recognize any interest
income on impaired loans in 2005, 2004 or 2003.
Loans and loans held for sale that are not included in
nonperforming or past due categories but cause us to be