PNC Bank 2005 Annual Report Download - page 118
Download and view the complete annual report
Please find page 118 of the 2005 PNC Bank annual report below. You can navigate through the pages in the report by either clicking on the pages listed below, or by using the keyword search tool below to find specific information within the annual report.-
 1
1 -
2
-
3
-
4
-
5
-
6
-
7
-
8
-
9
-
10
-
11
-
12
-
13
-
14
-
15
-
16
-
17
-
18
-
19
-
20
-
21
-
22
-
23
-
24
-
25
-
26
-
27
-
28
-
29
-
30
-
31
-
32
-
33
-
34
-
35
-
36
-
37
-
38
-
39
-
40
-
41
-
42
-
43
-
44
-
45
-
46
-
47
-
48
-
49
-
50
-
51
-
52
-
53
-
54
-
55
-
56
-
57
-
58
-
59
-
60
-
61
-
62
-
63
-
64
-
65
-
66
-
67
-
68
-
69
-
70
-
71
-
72
-
73
-
74
-
75
-
76
-
77
-
78
-
79
-
80
-
81
-
82
-
83
-
84
-
85
-
86
-
87
-
88
-
89
-
90
-
91
-
92
-
93
-
94
-
95
-
96
-
97
-
98
-
99
-
100
-
101
-
102
-
103
-
104
-
105
-
106
-
107
-
 108
108 -
 109
109 -
 110
110 -
 111
111 -
 112
112 -
 113
113 -
 114
114 -
 115
115 -
 116
116 -
 117
117 -
 118
118 -
 119
119 -
 120
120 -
 121
121 -
 122
122 -
 123
123 -
 124
124 -
 125
125 -
 126
126 -
 127
127 -
 128
128 -
129
-
130
-
131
-
132
-
133
-
134
-
135
-
136
-
137
-
138
-
139
-
140
-
141
-
142
-
143
-
144
-
145
-
146
-
147
-
148
-
149
-
150
-
151
-
152
-
153
-
154
-
155
-
156
-
157
-
158
-
159
-
160
-
161
-
162
-
163
-
164
-
165
-
166
-
167
-
168
-
169
-
170
-
171
-
172
-
173
-
174
-
175
-
176
-
177
-
178
-
179
-
180
-
181
-
182
-
183
-
184
-
185
-
186
-
187
-
188
-
189
-
190
-
191
-
192
-
193
-
194
-
195
-
196
-
197
-
198
-
199
-
200
-
201
-
202
-
203
-
204
-
205
-
206
-
207
-
208
-
209
-
210
-
211
-
212
-
213
-
214
-
215
-
216
-
217
-
218
-
219
-
220
-
221
-
222
-
223
-
224
-
225
-
226
-
227
-
228
-
229
-
230
-
231
-
232
-
233
-
234
-
235
-
236
-
237
-
238
-
239
-
240
-
241
-
242
-
243
-
244
-
245
-
246
-
247
-
248
-
249
-
250
-
251
-
252
-
253
-
254
-
255
-
256
-
257
-
258
-
259
-
260
-
261
-
262
-
263
-
264
-
265
-
266
-
267
-
268
-
269
-
270
-
271
-
272
-
273
-
274
-
275
-
276
-
277
-
278
-
279
-
280
-
281
-
282
-
283
-
284
-
285
-
286
-
287
-
288
-
289
-
290
-
291
-
292
-
293
-
294
-
295
-
296
-
297
-
298
-
299
-
300
 |
 |
118
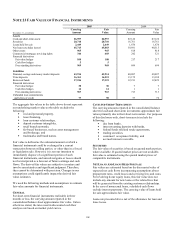
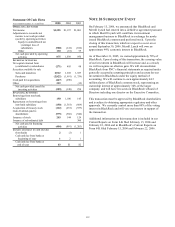
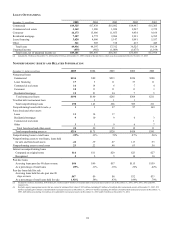
SHORT-TERM BORROWINGS
Federal funds purchased include overnight borrowings and term federal funds, which are payable at maturity. Repurchase
agreements generally have maturities of 18 months or less. Approximately 59% of our total bank notes mature in 2006. The
commercial paper is issued in maturities not to exceed 270 days. Other short-term borrowings primarily consist of overnight
borrowings which are secured by collateral and US Treasury, tax and loan borrowings, which are payable on demand. At
December 31, 2005, 2004 and 2003, $5.3 billion, $3.7 billion and $3.2 billion, respectively, notional value of interest rate swaps
were designated to borrowed funds. The effect of these swaps is included in the rates set forth in the following table.
SHORT-TERM BORROWINGS
2005 2004 2003
Dollars in millions Amount Rate Amount Rate Amount Rate
Federal funds purchased
Year-end balance $4,128 4.07% $219
1.86% $169 .96%
Average during year 2,098 3.38 1,957
1.33 904 1.11
Maximum month-end balance during year 4,128 2,648
2,358
Repurchase agreements
Year-end balance 1,691 3.88 1,376
2.00 1,081 .96
Average during year 2,189 2.97 1,433
1.26 1,110 1.08
Maximum month-end balance during year 3,407 2,490
1,254
Bank notes
Year-end balance 1,437 4.32 1,250
2.45 749 1.37
Average during year 1,289 3.37 889
1.81 1,099 1.57
Maximum month-end balance during year 1,600 1,250
1,853
Commercial paper
Year-end balance 10 4.25 2,251
2.34 2,226 1.14
Average during year 2,223 3.19 1,887
1.43 1,232 1.14
Maximum month-end balance during year 3,998 2,251
2,570
Other
Year-end balance 1,341 2.97 1,383
3.02 93 3.54
Average during year 1,664 2.32 514
2.21 109 3.30
Maximum month-end balance during year 3,361 1,383
162
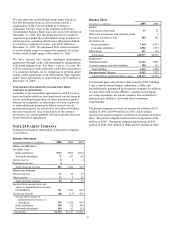
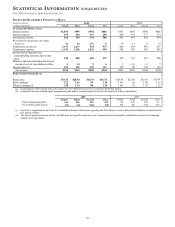
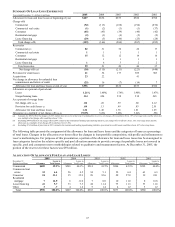
SELECTED LOAN MATURITIES AND INTEREST SENSITIVITY
December 31, 2005
In millions
1 Year
or Less
1 Through
5 Years
After 5
Years
Gross
Loans
Commercial $6,751 $10,450 $2,124
$19,325
Real estate projects 894 1,216 134
2,244
Total $7,645 $11,666 $2,258
$21,569
Loans with
Predetermined rate $1,060 $1,313 $847
$3,220
Floating or
adjustable rate 6,585 10,353 1,411
18,349
Total $7,645 $11,666 $2,258
$21,569
At December 31, 2005, $555 million notional of pay-fixed
interest rate swaps, futures and total return swaps were
designated to commercial loans as part of fair value hedge
strategies. The changes in fair value of the loans attributable to
the hedged risk are included in the commercial loan amount in
the above table. In addition, interest rate swaps were designated
as part of the cash flow hedging strategy that converted the
floating rate (1 month and 3 month LIBOR) on the underlying
commercial loans to a fixed rate as part of a risk management
strategy.
TIME DEPOSITS OF $100,000 OR MORE
Time deposits in foreign offices totaled $2.0 billion at
December 31, 2005, substantially all of which are in
denominations of $100,000 or more. The following table sets
forth maturities of domestic time deposits of $100,000 or more:
December 31, 2005 – in millions
Certificates
of Deposit
Three months or less $823
Over three through six months 732
Over six through twelve months 1,426
Over twelve months 2,084
Total $5,065
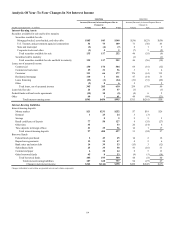
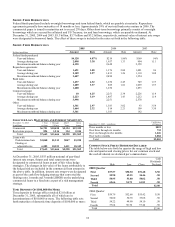
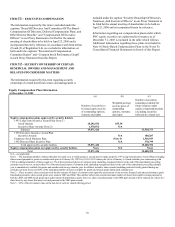
COMMON STOCK PRICES /DIVIDENDS DECLARED
The table below sets forth by quarter the range of high and low
sale and quarter-end closing prices for our common stock and
the cash dividends we declared per common share.
High
Low
Close
Cash
Dividends
Declared
2005 Quarter
First
$57.57 $50.30 $51.48 $.50
Second
55.90 49.35 54.46 .50
Third
58.95 53.80 58.02 .50
Fourth
65.66 54.73 61.83 .50
Total
$2.00
2004 Quarter
First
$59.79 $52.68 $55.42 $.50
Second
56.00 50.70 53.08 .50
Third
54.22 48.90 54.10 .50
Fourth
57.64 50.70 57.44 .50
Total
$2.00