PACCAR 2011 Annual Report Download - page 3
Download and view the complete annual report
Please find page 3 of the 2011 PACCAR annual report below. You can navigate through the pages in the report by either clicking on the pages listed below, or by using the keyword search tool below to find specific information within the annual report.-
 1
1 -
 2
2 -
 3
3 -
 4
4 -
 5
5 -
 6
6 -
 7
7 -
 8
8 -
 9
9 -
 10
10 -
 11
11 -
 12
12 -
 13
13 -
 14
14 -
15
-
16
-
17
-
18
-
19
-
20
-
21
-
22
-
23
-
24
-
25
-
26
-
27
-
28
-
29
-
30
-
31
-
32
-
33
-
34
-
35
-
36
-
37
-
38
-
39
-
40
-
41
-
42
-
43
-
44
-
45
-
46
-
47
-
48
-
49
-
50
-
51
-
52
-
53
-
54
-
55
-
56
-
57
-
58
-
59
-
60
-
61
-
62
-
63
-
64
-
65
-
66
-
67
-
68
-
69
-
70
-
71
-
72
-
73
-
74
-
75
-
76
-
77
-
78
-
79
-
80
-
81
-
82
-
83
-
84
-
85
-
86
-
87
-
88
-
89
-
90
 |
 |

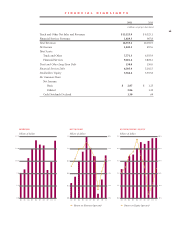
FINANCIAL HIGHLIGHTS
2011 2010
(millions except per share data)
Truck and Other Net Sales and Revenues $ 15,325.9 $ 9,325.1
Financial Services Revenues 1,029.3 967.8
Total Revenues 16,355.2 10,292.9
Net Income 1,042.3 457.6
Total Assets:
Truck and Other 7,771.3 6,355.9
Financial Services 9,401.4 7,878.2
Truck and Other Long-Term Debt 150.0 150.0
Financial Services Debt 6,505.4 5,102.5
Stockholders’ Equity 5,364.4 5,357.8
Per Common Share:
Net Income:
Basic $ 2.87 1.25
Diluted 2.86 1.25
Cash Dividends Declared 1.30 .69
REVENUES
billions of dollars
STOCKHOLDERS’ E Q U ITY
billions of dollars
NET INCOME
billions of dollars
Return on Equity (percent)
02 03 04 05 06 07 08 09 10 11
17.5
14.0
10.5
7.0
3.5
0.0
02 03 04 05 06 07 08 09 10 11
1.5
1.2
0.9
0.6
0.3
0.0
4%
6%
8%
10%
2%
0%
02 03 04 05 06 07 08 09 10 11
16%
24%
32%
40%
8%
0%
1.1
5.5
4.4
3.3
2.2
0.0
Return on Revenues (percent)
$