Omron 1999 Annual Report Download - page 3
Download and view the complete annual report
Please find page 3 of the 1999 Omron annual report below. You can navigate through the pages in the report by either clicking on the pages listed below, or by using the keyword search tool below to find specific information within the annual report.-
 1
1 -
 2
2 -
 3
3 -
 4
4 -
 5
5 -
 6
6 -
 7
7 -
 8
8 -
 9
9 -
 10
10 -
 11
11 -
 12
12 -
 13
13 -
 14
14 -
15
-
16
-
17
-
18
-
19
-
20
-
21
-
22
-
23
-
24
-
25
-
26
-
27
-
28
-
29
-
30
-
31
-
32
-
33
-
34
-
35
-
36
-
37
-
38
-
39
-
40
-
41
-
42
-
43
-
44
-
45
-
46
-
47
-
48
-
49
-
50
 |
 |

1
Thousands of
Millions of yen U.S. dollars (Note 3)
(except per share data) (except per share data)
1999 1998 1997 1999
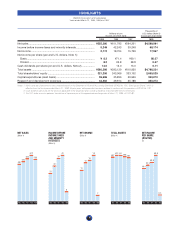
Net sales............................................................................................ ¥555,280 ¥611,795 ¥594,261 $4,589,091
Income before income taxes and minority interests ......................... 8,249 42,243 39,248 68,174
Net income ........................................................................................ 2,174 18,704 15,739 17,967
Net income per share (yen and U.S. dollars, Note 1):
Basic.............................................................................................. ¥ 8.3 ¥71.4 ¥60.1 $0.07
Diluted ........................................................................................... 8.3 69.8 58.8 0.07
Cash dividends per share (yen and U.S. dollars, Note 2).................. 13.0 13.0 13.0 0.11
Total assets ....................................................................................... ¥580,586 ¥593,129 ¥610,930 $4,798,231
Total shareholders’ equity ................................................................. 321,258 343,066 333,102 2,655,025
Capital expenditures (cash basis) ..................................................... 36,696 35,896 29,956 303,273
Research and development expenses .............................................. 42,383 39,914 35,188 350,273
Notes: 1. Net income per share amounts are computed based on the Statement of Financial Accounting Standards (SFAS) No. 128, “Earnings per Share,” which is
effective from the fiscal year ended March 31, 1998. All prior years’ data presented has been restated to conform with the provisions of SFAS No. 128.
2. Cash dividends per share are the amounts applicable to the respective year, including dividends to be paid after the end of the year.
3. The U.S. dollar amounts represent translations of Japanese yen at the approximate exchange rate at March 31, 1999, of ¥121=$1.
HIGHLIGHTS
OMRON Corporation and Subsidiaries
Years ended March 31, 1999, 1998 and 1997
490
525
564
612
555
NET SALES
(Billion ¥)
’95 ’96 ’97 ’98 ’99
25
32
39
42
8
INCOME BEFORE
INCOME TAXES
AND MINORITY
INTERESTS
(Billion ¥)
’95 ’96 ’97 ’98 ’99
12
15
16
19
2
NET INCOME
(Billion ¥)
’95 ’96 ’97 ’98 ’99
587 613 611 593 581
49.4
54.5
58.8
69.8
8.3
TOTAL ASSETS
(Billion ¥)
’95 ’96 ’97 ’98 ’99
NET INCOME
PER SHARE
(DILUTED)
(¥)
’95 ’96 ’97 ’98 ’99