Olympus 2008 Annual Report Download - page 6
Download and view the complete annual report
Please find page 6 of the 2008 Olympus annual report below. You can navigate through the pages in the report by either clicking on the pages listed below, or by using the keyword search tool below to find specific information within the annual report.-
 1
1 -
 2
2 -
 3
3 -
 4
4 -
 5
5 -
 6
6 -
 7
7 -
 8
8 -
 9
9 -
 10
10 -
 11
11 -
 12
12 -
 13
13 -
 14
14 -
 15
15 -
 16
16 -
 17
17 -
18
-
19
-
20
-
21
-
22
-
23
-
24
-
25
-
26
-
27
-
28
-
29
-
30
-
31
-
32
-
33
-
34
-
35
-
36
-
37
-
38
-
39
-
40
-
41
-
42
-
43
-
44
-
45
-
46
-
47
-
48
-
49
-
50
-
51
-
52
-
53
-
54
-
55
-
56
-
57
-
58
-
59
-
60
-
61
-
62
-
63
-
64
-
65
-
66
-
67
-
68
 |
 |

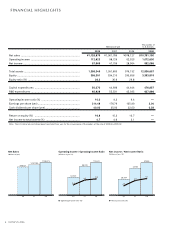
FINANCIAL HIGHLIGHTS
Net Sales
(Millions of yen)
06 07 08 06 07 08 06 07 08
978,127
1,061,786
1,128,875
62,523
98,729
112,623
28,564
2.9
47,799
57,969
Operating income ratio (%)
Operating Income / Operating Income Ratio
(Millions of yen / %)
Net income ratio (%)
Net Income / Net Income Ratio
(Millions of yen / %)
10.0
6.4
9.3 5.1
4.5
Thousands of
Millions of yen U.S. dollars
2008 2007 2006 2008
Net sales ............................................................................. ¥1,128,875 ¥1,061,786 ¥978,127 $10,751,190
Operating income ................................................................ 112,623 98,729 62,523 1,072,600
Net income .......................................................................... 57,969 47,799 28,564 552,086
Total assets ......................................................................... 1,358,349 1,091,800 976,132 12,936,657
Equity .................................................................................. 356,351 334,210 290,656 3,393,819
Equity ratio (%) .................................................................... 26.2 30.6 29.8 —
Capital expenditures ........................................................... 50,070 44,696 44,444 476,857
R&D expenditures ................................................................ 65,928 55,531 45,935 627,886
Operating income ratio (%) .................................................. 10.0 9.3 6.4 —
Earnings per share (yen) ....................................................... 214.48 176.79 105.99 2.04
Cash dividends per share (yen) ............................................. 40.00 35.00 22.00 0.38
Return on equity (%) ........................................................... 16.8 15.3 10.7 —
Net income to total assets (%) ............................................ 4.7 4.6 3.1 —
Note: The U.S. dollar amounts have been translated from yen, for the convenience of the reader, at the rate of ¥105.00=US$1.00
4 OLYMPUS 2008