Oki 2014 Annual Report Download - page 4
Download and view the complete annual report
Please find page 4 of the 2014 Oki annual report below. You can navigate through the pages in the report by either clicking on the pages listed below, or by using the keyword search tool below to find specific information within the annual report.-
 1
1 -
 2
2 -
 3
3 -
 4
4 -
 5
5 -
 6
6 -
 7
7 -
 8
8 -
 9
9 -
 10
10 -
 11
11 -
 12
12 -
 13
13 -
 14
14 -
 15
15 -
16
-
17
-
18
-
19
-
20
-
21
-
22
-
23
-
24
-
25
-
26
-
27
-
28
-
29
-
30
-
31
-
32
-
33
-
34
-
35
-
36
-
37
-
38
-
39
-
40
-
41
-
42
-
43
-
44
-
45
-
46
-
47
-
48
-
49
-
50
-
51
-
52
-
53
-
54
 |
 |

2Annual Report 2014
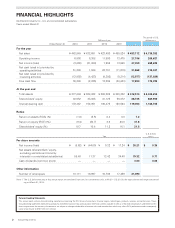
FINANCIAL HIGHLIGHTS
Oki Electric Industry Co., Ltd. and consolidated subsidiaries
Years ended March 31
Millions of yen
Thousands of U.S.
dollars (Note 1)
Ended March 31 2010 2011 2012 2013 2014 2014
For the year
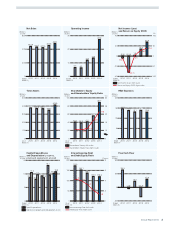
Net sales ¥ 442,949 ¥ 432,651 ¥ 423,480 ¥ 455,824 ¥ 483,112 $ 4,736,392
Operating income 6,508 6,308 11,980 13,475 27,196 266,627
Net income (loss) (3,836) (31,809) 1,555 13,599 27,359 268,225
Net cash (used in) provided by
operating activities 51,290 1,588 22,791 (11,619) 31,868 312,431
Net cash (used in) provided by
investing activities (12,992) (4,423) (9,392) (9,214) (13,977) (137,029)
Free cash fl ow 38,298 (2,835) 13,399 (20,833) 17,890 175,392
At the year end
Total assets ¥ 377,894 ¥ 368,822 ¥ 368,065 ¥ 349,322 ¥ 412,514 $ 4,044,254
Shareholders’ equity 40,532 38,308 41,125 56,072 88,735 869,950
Interest-bearing debt 172,467 152,051 136,478 120,524 119,004 1,166,705
Ratios
Return on assets (ROA) (%) (1.0) (8.5) 0.4 3.8 7.2
Return on equity (ROE) (%) (9.4) (80.7) 3.9 28.0 37.8
Shareholders’ equity (%) 10.7 10.4 11.2 16.1 21.5
Yen
U.S. dollars
(Note 1)
Per share amounts
Net income (loss) ¥ (5.62) ¥ (44.00) ¥ 0.32 ¥ 17.24 ¥ 36.21 $ 0.35
Net assets (shareholders’ equity,
excluding warrants and minority
interests in consolidated subsidiaries) 59.40 11.37 13.42 34.40 79.32 0.77
Cash dividends (common stock) — — — — 3.00 0.02
Other information
Number of employees 18,111 16,697 16,736 17,459 21,090
Forward-looking Statements
This annual report contains forward-looking statements concerning the OKI Group’s future plans, fi nancial targets, technologies, products, services and performance. These
forward-looking statements represent assumptions and beliefs based on data and calculation methods currently available to OKI as of the date of publication, and therefore OKI
does not guarantee the accuracy of statements are subject to changes attributable to business risks and uncertainties, which may affect OKI’s performance and consequently
cause actual results to differ from our forecasts.
Note 1: The U.S. dollar amounts in this annual report are translated from yen, for convenience only, at ¥102 = U.S. $1.00, the approximate exchange rate prevail-
ing on March 31, 2014.