Occidental Petroleum 2014 Annual Report Download - page 13
Download and view the complete annual report
Please find page 13 of the 2014 Occidental Petroleum annual report below. You can navigate through the pages in the report by either clicking on the pages listed below, or by using the keyword search tool below to find specific information within the annual report.-
 1
1 -
2
-
 3
3 -
 4
4 -
 5
5 -
 6
6 -
 7
7 -
 8
8 -
 9
9 -
 10
10 -
 11
11 -
 12
12 -
 13
13 -
 14
14 -
 15
15 -
 16
16 -
 17
17 -
 18
18 -
 19
19 -
 20
20 -
 21
21 -
 22
22 -
 23
23 -
24
-
25
-
26
-
27
-
28
-
29
-
30
-
31
-
32
-
33
-
34
-
35
-
36
-
37
-
38
-
39
-
40
-
41
-
42
-
43
-
44
-
45
-
46
-
47
-
48
-
49
-
50
-
51
-
52
-
53
-
54
-
55
-
56
-
57
-
58
-
59
-
60
-
61
-
62
-
63
-
64
-
65
-
66
-
67
-
68
-
69
-
70
-
71
-
72
-
73
-
74
-
75
-
76
-
77
-
78
-
79
-
80
-
81
-
82
-
83
-
84
-
85
-
86
-
87
-
88
-
89
-
90
-
91
-
92
-
93
-
94
-
95
-
96
-
97
-
98
-
99
-
100
-
101
-
102
-
103
-
104
-
105
-
106
-
107
-
108
-
109
-
110
-
111
-
112
-
113
-
114
-
115
-
116
-
117
-
118
-
119
-
120
-
121
-
122
-
123
-
124
-
125
-
126
-
127
-
128
-
129
-
130
-
131
-
132
-
133
-
134
-
135
-
136
-
137
-
138
-
139
-
140
-
141
-
142
-
143
-
144
-
145
-
146
-
147
-
148
 |
 |

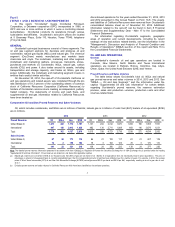
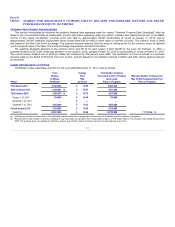
ITEM 6 SELECTED FINANCIAL DATA
FIVE-YEAR SUMMARY OF SELECTED FINANCIAL DATA
(in millions, except per-share amounts)
As of and for the years ended December 31,
2013
2012
2011
2010
Net sales
$ 20,170
$ 20,100 $ 20,001 $ 16,129
Income (loss) from continuing operations
$ 4,932
$ 3,829 $ 5,527 $ 3,851
Net income attributable to common stock
$ 5,903
$ 4,598 $ 6,771 $ 4,530
Basic earnings per common share from continuing operations
$ 6.12
$ 4.72 $ 6.79 $ 4.65
Basic earnings per common share
$ 7.33
$ 5.67 $ 8.32 $ 5.57
Diluted earnings per common share
$ 7.32
$ 5.67 $ 8.32 $ 5.56
Total assets
$ 69,443
$ 64,210 $ 60,044 $ 52,432
Long-term debt, net
$ 6,939
$ 7,023 $ 5,871 $ 5,111
Stockholders’ equity
$ 43,372
$ 40,048 $ 37,620 $ 32,484
$ 75,699
$ 61,710
$ 75,992
$ 79,735
Cash flow from operations
$ 10,229
$ 9,050 $ 9,740 $ 7,498
Capital expenditures
$ (7,357)
$ (7,874)
$ (5,354)
$ (2,884)
Cash provided (used) by all other investing activities, net
$ 1,040
$ (1,989)
$ (3,530)
$ (4,476)
Cash dividends paid
$ (1,553) (c) $ (2,128) (c) $ (1,436)
$ (1,159)
Purchases of treasury stock
$ (943)
$ (583)
$ (274)
$ (67)
Cash provided (used) by all other financing activities, net
$ (437)
$ 1,865 $ 535 $ 2,309
$ 2.56
$ 2.16 $ 1.84 $ 1.47
804
809 812 812
Note
ITEM 7
MANAGEMENT'S DISCUSSION AND ANALYSIS OF FINANCIAL CONDITION AND RESULTS
OF OPERATIONS (MD&A)
12