Occidental Petroleum 2008 Annual Report Download - page 9
Download and view the complete annual report
Please find page 9 of the 2008 Occidental Petroleum annual report below. You can navigate through the pages in the report by either clicking on the pages listed below, or by using the keyword search tool below to find specific information within the annual report.-
 1
1 -
 2
2 -
 3
3 -
 4
4 -
 5
5 -
 6
6 -
 7
7 -
 8
8 -
 9
9 -
 10
10 -
 11
11 -
 12
12 -
 13
13 -
 14
14 -
 15
15 -
 16
16 -
 17
17 -
 18
18 -
 19
19 -
 20
20 -
21
-
22
-
23
-
24
-
25
-
26
-
27
-
28
-
29
-
30
-
31
-
32
-
33
-
34
-
35
-
36
-
37
-
38
-
39
-
40
-
41
-
42
-
43
-
44
-
45
-
46
-
47
-
48
-
49
-
50
-
51
-
52
-
53
-
54
-
55
-
56
-
57
-
58
-
59
-
60
-
61
-
62
-
63
-
64
-
65
-
66
-
67
-
68
-
69
-
70
-
71
-
72
-
73
-
74
-
75
-
76
-
77
-
78
-
79
-
80
-
81
-
82
-
83
-
84
-
85
-
86
-
87
-
88
-
89
-
90
-
91
-
92
-
93
-
94
-
95
-
96
-
97
-
98
-
99
-
100
-
101
-
102
-
103
-
104
-
105
-
106
-
107
-
108
-
109
-
110
-
111
-
112
-
113
-
114
-
115
-
116
 |
 |

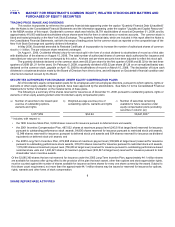
SHARE REPURCHASE ACTIVITIES
Occidental’s share repurchase activities for the year ended December 31, 2008 were as follows:
Period
Total
Number
of Shares
Purchased
Average
Price
Paid
per Share
Total Number of Shares
Purchased as Part of
Publicly Announced
Plans or Programs
Maximum Number of
Shares that May Yet be
Purchased Under the
Plans or Programs (a)
First Quarter 2008 6,253,932 $69.68 6,111,975
Second Quarter 2008 5,143,716 $88.14 4,684,150
Third Quarter 2008 8,391,244 $74.05 8,391,244
October 1 - 31, 2008 — — —
November 1 - 30, 2008 — — —
December 1 - 31, 2008 — — —
Fourth Quarter 2008 — — —
Total 2008 19,788,892 $76.33 19,187,369 27,155,575
(a) In February 2008 and July 2008, Occidental increased the number of shares authorized for its share repurchase program from 55 to 75 million and from 75 to 95
million, respectively.
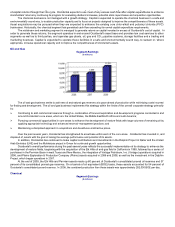
PERFORMANCE GRAPH
The following graph compares the yearly percentage change in Occidental’s cumulative total return on its common stock with the
cumulative total return of the Standard & Poor's 500 Stock Index and with that of Occidental’s peer group over the five-year period ended on
December 31, 2008. The graph assumes that $100 was invested in Occidental common stock, in the stock of the companies in the Standard
& Poor's 500 Index and in a portfolio of the peer group companies weighted by their relative market values each year and that all dividends
were reinvested.
Occidental's peer group consists of Anadarko Petroleum Corporation, Apache Corporation, BP p.l.c. (BP), Chevron Corporation,
ConocoPhillips, Devon Energy Corporation, ExxonMobil Corporation, Royal Dutch Shell plc and Occidental. Analysis for the peer group
includes five years of historical performance data as noted above for the common stock of each of the companies.
12/31/03 12/31/04 12/31/05 12/31/06 12/31/07 12/31/08
$100 $141 $197 $244 $392 $311
100 125 145 180 226 170
100 111 116 135 142 90
The information provided in this Performance Graph shall not be deemed "soliciting material" or "filed" with the Securities and Exchange Commission or subject
to Regulation 14A or 14C under the Securities Exchange Act of 1934 (Exchange Act), other than as provided in Item 201 to Regulation S-K under the Exchange
Act, or subject to the liabilities of Section 18 of the Exchange Act and shall not be deemed incorporated by reference into any filing under the Securities Act of
1933 or the Exchange Act except to the extent Occidental specifically requests that it be treated as soliciting material or specifically incorporates it by reference.
9
ITEM 6 SELECTED FINANCIAL DATA