O'Reilly Auto Parts 2004 Annual Report Download - page 3
Download and view the complete annual report
Please find page 3 of the 2004 O'Reilly Auto Parts annual report below. You can navigate through the pages in the report by either clicking on the pages listed below, or by using the keyword search tool below to find specific information within the annual report.-
 1
1 -
 2
2 -
 3
3 -
 4
4 -
 5
5 -
 6
6 -
 7
7 -
 8
8 -
 9
9 -
 10
10 -
 11
11 -
 12
12 -
 13
13 -
 14
14 -
15
-
16
-
17
-
18
-
19
-
20
-
21
-
22
-
23
-
24
-
25
-
26
-
27
-
28
-
29
-
30
-
31
-
32
-
33
-
34
-
35
-
36
-
37
-
38
-
39
-
40
-
41
-
42
-
43
-
44
-
45
-
46
-
47
-
48
-
49
-
50
-
51
-
52
-
53
-
54
-
55
-
56
 |
 |

In thousands, except earnings per share data and operating data (a)
Year ended December 31 2004 2003 2002 2001 2000
Product Sales $1,721,241 $1,511,816 $1,312,490 $1,092,112 $890,421
Operating Income 190,458 165,275 138,301 113,831 90,029
Net Income 117,674 100,087 81,992 66,352 51,708
Working Capital 479,662 441,617 483,623 429,527 296,272
Total Assets 1,432,357 1,157,033 1,009,419 856,859 715,995
Long-Term Debt 100,322 120,977 190,470 165,618 90,463
Shareholders' Equity 947,817 784,285 650,524 556,291 463,731
Net Income Per Common Share
(assuming dilution) 2.11 1.84 1.53 1.26 1.00
Weighted-Average Common Share
(assuming dilution) 55,711 54,530 53,692 52,786 51,728
Stores At Year-End 1,249 1,109 981 875 672
Same-Store Sales Gain 6.8% 7.8% 3.7% 8.8% 5.0%
2004 FINANCIAL HIGHLIGHTS
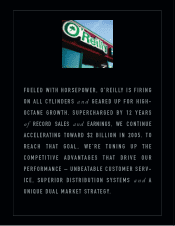
In 2001, we set our 2-4-Your Future goal of reaching $2 billion in sales by December 31, 2005. In 2005, Team O’Reilly is revved up and geared
toward providing outstanding customer service, driving us to reach our goal of $2 billion in sales, this year.
Earnings per share, assuming dilution,
increased 14.7% over 2003.
Earnings Per Share (a)
(assuming dilution)
Continued focus on driving sales and
taking market share along with our
relentless watch over expenses, gave us a
17.6% increase in net income in
2004 over 2003.
Net Income (a)
(in millions)
As a result of our excellent customer
service, which drives sales and our
continued efforts in controlling expenses,
our operating margin for 2004 was 11.1%.
Operating Income (a)
(in millions)
20042003200220012000
$1.53
$2.11
$1.26
$1.84
$1.00
20042003200220012000
$82.0
$117.7
$66.4
$100.1
$51.7
20042003200220012000
$138.3
$190.5
$113.8
$165.3
$90.0
(a) 2004 figures are based on income before cumulative effect of accounting change.