Nucor 2015 Annual Report Download - page 5
Download and view the complete annual report
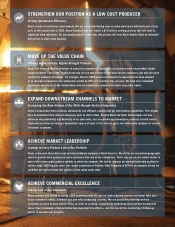
Please find page 5 of the 2015 Nucor annual report below. You can navigate through the pages in the report by either clicking on the pages listed below, or by using the keyword search tool below to find specific information within the annual report.-
 1
1 -
 2
2 -
 3
3 -
 4
4 -
 5
5 -
 6
6 -
 7
7 -
 8
8 -
 9
9 -
 10
10 -
 11
11 -
 12
12 -
 13
13 -
 14
14 -
 15
15 -
 16
16 -
17
-
18
-
19
-
20
-
21
-
22
-
23
-
24
-
25
-
26
-
27
-
28
-
29
-
30
-
31
-
32
-
33
-
34
-
35
-
36
-
37
-
38
-
39
-
40
-
41
-
42
-
43
-
44
-
45
-
46
-
47
-
48
-
49
-
50
-
51
-
52
-
53
-
54
-
55
-
56
-
57
-
58
-
59
-
60
-
61
-
62
-
63
-
64
-
65
-
66
-
67
-
68
-
69
-
70
-
71
-
72
-
73
-
74
-
75
-
76
-
77
-
78
-
79
-
80
-
81
-
82
-
83
-
84
-
85
-
86
-
87
-
88
-
89
-
90
-
91
-
92
-
93
-
94
-
95
-
96
-
97
-
98
 |
 |

FORWARD-LOOKING STATEMENTS Certain statements made in this annual report are forward-looking statements that involve risks and uncertainties.
The words “believe,” “expect,” “project,” “will,” “should,” “could” and similar expressions are intended to identify those forward-looking statements. These
forward-looking statements reflect the Company’s best judgment based on current information, and although we base these statements on circumstances
that we believe to be reasonable when made, there can be no assurance that future events will not affect the accuracy of such forward-looking information.
As such, the forward-looking statements are not guarantees of future performance, and actual results may vary materially from the projected results and
expectations discussed in this report. Factors that might cause the Company’s actual results to differ materially from those anticipated in forward-looking
statements include, but are not limited to: (1) competitive pressure on sales and pricing, including pressure from imports and substitute materials; (2) U.S.
and foreign trade policies affecting steel imports or exports; (3) the sensitivity of the results of our operations to prevailing steel prices and changes in the
supply and cost of raw materials, including pig iron, iron ore and scrap steel; (4) availability and cost of electricity and natural gas which could negatively
affect our cost of steel production or could result in a delay or cancelation of existing or future drilling within our natural gas working interest drilling
programs; (5) critical equipment failures and business interruptions; (6) market demand for steel products, which, in the case of many of our products,
is driven by the level of nonresidential construction activity in the U.S.; (7) impairment in the recorded value of inventory, equity investments, fixed assets,
goodwill or other long-lived assets; (8) uncertainties surrounding the global economy, including the severe economic downturn in construction markets and
excess world capacity for steel production; (9) fluctuations in currency conversion rates; (10) significant changes in laws or government regulations affecting
environmental compliance, including legislation and regulations that result in greater regulation of greenhouse gas emissions that could increase our
energy costs and our capital expenditures and operating costs or cause one or more of our permits to be revoked or make it more difficult to obtain permit
modifications; (11) the cyclical nature of the steel industry; (12) capital investments and their impact on our performance; and (13) our safety performance.
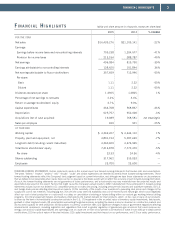
3
FINANCIAL HIGHLIGHTS
FI N A N C I A L H I G H L I G H T S (dollar and share amounts in thousands, except per share data)
2015 2014 % CHANGE
FOR THE YEAR
Net sales $16,439,276 $21,105,141 -22%
Earnings:
Earnings before income taxes and noncontrolling interests 709,238 1,204,577 -41%
Provision for income taxes 213,154 388,787 -45%
Net earnings 496,084 815,790 -39%
Earnings attributable to noncontrolling interests 138,425 101,844 36%
Net earnings attributable to Nucor stockholders 357,659 713,946 -50%
Per share:
Basic 1.11 2.22 -50%
Diluted 1.11 2.22 -50%
Dividends declared per share 1.4925 1.4825 1%
Percentage of net earnings to net sales 2.2% 3.4%
Return on average stockholders’ equity 4.7% 9.3%
Capital expenditures 364,768 568,867 -36%
Depreciation 625,757 652,000 -4%
Acquisitions (net of cash acquired) 19,089 768,581 not meaningful
Sales per employee 690 921 -25%
AT YEAR END
Working capital $ 4,369,207 $ 4,344,112 1%
Property, plant and equipment, net 4,891,153 5,287,639 -7%
Long-term debt (including current maturities) 4,360,600 4,376,935 —
Total Nucor stockholders’ equity 7,416,878 7,772,470 -5%
Per share 23.33 24.36 -4%
Shares outstanding 317,962 319,033 —
Employees 23,700 23,600 —