Nokia 2006 Annual Report Download - page 164
Download and view the complete annual report
Please find page 164 of the 2006 Nokia annual report below. You can navigate through the pages in the report by either clicking on the pages listed below, or by using the keyword search tool below to find specific information within the annual report.-
 1
1 -
2
-
3
-
4
-
5
-
6
-
7
-
8
-
9
-
10
-
11
-
12
-
13
-
14
-
15
-
16
-
17
-
18
-
19
-
20
-
21
-
22
-
23
-
24
-
25
-
26
-
27
-
28
-
29
-
30
-
31
-
32
-
33
-
34
-
35
-
36
-
37
-
38
-
39
-
40
-
41
-
42
-
43
-
44
-
45
-
46
-
47
-
48
-
49
-
50
-
51
-
52
-
53
-
54
-
55
-
56
-
57
-
58
-
59
-
60
-
61
-
62
-
63
-
64
-
65
-
66
-
67
-
68
-
69
-
70
-
71
-
72
-
73
-
74
-
75
-
76
-
77
-
78
-
79
-
80
-
81
-
82
-
83
-
84
-
85
-
86
-
87
-
88
-
89
-
90
-
91
-
92
-
93
-
94
-
95
-
96
-
97
-
98
-
99
-
100
-
101
-
102
-
103
-
104
-
105
-
106
-
107
-
108
-
109
-
110
-
111
-
112
-
113
-
114
-
115
-
116
-
117
-
118
-
119
-
120
-
121
-
122
-
123
-
124
-
125
-
126
-
127
-
128
-
129
-
130
-
131
-
132
-
133
-
134
-
135
-
136
-
137
-
138
-
139
-
140
-
141
-
142
-
143
-
144
-
145
-
146
-
147
-
148
-
149
-
150
-
151
-
152
-
153
-
 154
154 -
 155
155 -
 156
156 -
 157
157 -
 158
158 -
 159
159 -
 160
160 -
 161
161 -
 162
162 -
 163
163 -
 164
164 -
 165
165 -
 166
166 -
 167
167 -
 168
168 -
 169
169 -
 170
170 -
 171
171 -
 172
172 -
 173
173 -
 174
174 -
175
-
176
-
177
-
178
-
179
-
180
-
181
-
182
-
183
-
184
-
185
-
186
-
187
-
188
-
189
-
190
-
191
-
192
-
193
-
194
-
195
-
196
-
197
-
198
-
199
-
200
-
201
-
202
-
203
-
204
-
205
-
206
-
207
-
208
-
209
-
210
-
211
-
212
-
213
-
214
-
215
-
216
 |
 |

Notes to the Consolidated Financial Statements (Continued)
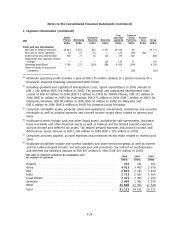
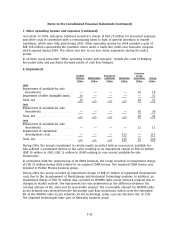
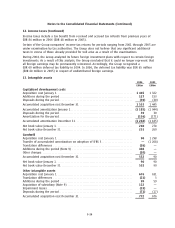
5. Pensions (Continued)
The Groups’s pension plan asset allocation as a percentage of plan assets at December 31, 2006, and
2005, by asset category are as follows:
2006 2005
Domestic Foreign Domestic Foreign
%%%%
Asset Category:
Equity securities ***************************************** 11 27 25 26
Debt securities******************************************* 75 61 72 62
Insurance contracts*************************************** —11—11
Real estate ********************************************** 1— 2—
Shortterm investments *********************************** 13 1 11
Total**************************************************** 100 100 100 100
The objective of the investment activities is to maximize the excess of plan assets over projected
benefit obligations, within an accepted risk level, taking into account the interest rate and inflation
sensitivity of the assets as well as the obligations. As of December 31, 2006 the target asset
allocation for both domestic as well as foreign plans was 100% long dated debt securities. In
addition, a risk limit has been approved to tactically deviate from the target asset allocation.
The Pension Committee of the Group, consisting of the CFO, Head of Treasury, Head of HR and other
HR representatives, approves both the target asset allocation as well as the deviation limit.
Derivative instruments can be used to change the portfolio asset allocation and risk characteristics.
The domestic pension plans’ assets did not include Nokia securities in 2006 (EUR 6 million in 2005).
The foreign pension plan assets include a self investment through a loan provided to Nokia by the
Group’s German pension fund of EUR 88 million (EUR 62 million in 2005). See Note 33.
The actual return on plan assets was EUR 51 million in 2006 (EUR 147 million in 2005).
In 2007, the Group expects to make contributions of EUR 50 million and EUR 29 million to its
domestic and foreign defined benefit pension plans, respectively.
6. Advertising and promotional expenses
The Group expenses advertising and promotion costs as incurred. Advertising and promotional
expenses were EUR 1 515 million in 2006 (EUR 1 481 million in 2005 and EUR 1 144 million in 2004).
7. Other operating income and expenses
Other operating income for 2006 includes a gain of EUR 276 million representing Nokia’s share of
the proceeds relating to a partial recovery of a previously impaired financing arrangement with
Telsim. Other operating expenses for 2006 includes EUR 142 million charges primarily related to the
restructuring for the CDMA business and associated asset writedowns. Working together with co
development partners, Nokia intends to selectively participate in key CDMA markets, with special
focus on North America, China and India. Accordingly, Nokia is ramping down its CDMA research,
development and production which will cease by April 2007. In 2006, Enterprise Solutions recorded a
charge of EUR 8 million for personnel expenses and other costs as a result of more focused R&D.
Other operating income for 2005 includes a gain of EUR 61 million relating to the divestiture of the
Group’s Tetra business, a EUR 18 million gain related to the partial sale of a minority investment
(see Note 15) and a EUR 45 million gain related to qualifying sales and leaseback transactions for
F29