Nintendo 2014 Annual Report Download - page 8
Download and view the complete annual report
Please find page 8 of the 2014 Nintendo annual report below. You can navigate through the pages in the report by either clicking on the pages listed below, or by using the keyword search tool below to find specific information within the annual report.-
 1
1 -
 2
2 -
 3
3 -
 4
4 -
 5
5 -
 6
6 -
 7
7 -
 8
8 -
 9
9 -
 10
10 -
 11
11 -
 12
12 -
 13
13 -
 14
14 -
 15
15 -
 16
16 -
 17
17 -
 18
18 -
 19
19 -
20
-
21
-
22
-
23
-
24
-
25
-
26
-
27
-
28
-
29
-
30
-
31
-
32
-
33
-
34
-
35
-
36
-
37
-
38
-
39
-
40
-
41
-
42
-
43
-
44
-
45
-
46
-
47
-
48
-
49
-
50
-
51
 |
 |
- 6 -
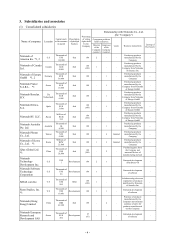
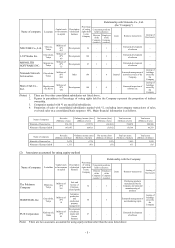
II. Business Overview
1. Overview of operating results and cash flow
(1) Operating results
Nintendo Co., Ltd. (the “Company”) and its consolidated subsidiaries (together with the Company,“Nintendo”)
continue to pursue its basic strategy of “Gaming Population Expansion” by offering compelling products that
anyone can enjoy, regardless of age, gender or gaming experience.
During the fiscal year ended March 31, 2014, for “Nintendo 3DS (3DS, 3DS XL and 2DS),” “Pokémon
X/Pokémon Y,” simultaneously released globally in October last year, marked 12.26 million units in sales, while
“Animal Crossing: New Leaf,” released in Japan in the previous fiscal year and in the United States and Europe
in June last year, marked 3.80 million units (7.66 million units on a cumulative basis) in sales. In addition, key
first-party titles such as “Luigi’s Mansion: Dark Moon,” “The Legend of Zelda: A Link Between Worlds” and
“Mario & Luigi: Dream Team” showed steady sales, with each title selling more than two million units.
Moreover, there have also been hit titles from third-party publishers. As a result, the global sales of the
“Nintendo 3DS” hardware and software reached 12.24 million and 67.89 million units respectively.
With respect to “Wii U,” while five key first-party titles, such as “Super Mario 3D World,” “New Super Mario
Bros. U” and “New Super Luigi U” became million-seller titles, the “Wii U” business as a whole showed slow
growth. The global sales of the “Wii U” hardware and software reached only 2.72 million and 18.86 million units
respectively.
Regarding “Nintendo DS (DS, DS Lite, DSi and DSi XL),” the global sales of its hardware and software were
0.13 million and 10.29 million units respectively. Also, the sales of the “Wii” hardware and software were 1.22
million and 26.16 million units respectively.
As a result, net sales were ¥571.7 billion (U.S.$5,550 million; a decrease of 10.0% on a year-on-year basis), of
which overseas sales were ¥394.7 billion (U.S.$3,832 million; a decrease of 7.4% on a year-on-year basis, and
69.0% of total sales). The “Wii U” hardware still has a negative impact on Nintendo’s profits owing mainly to its
markdown in the United States and Europe, and unit sales of software, which has high profit margins, did not
grow sufficiently, leading to a gross profit of ¥163.2 billion (U.S.$1,584 million). Total selling, general and
administrative expenses exceeded gross profit, resulting in an operating loss of ¥46.4 billion (U.S.$450 million;
compared with an operating loss of ¥36.4 billion in the previous fiscal year). Also, due to depreciation of the yen
at the end of this period compared with the one at the end of the previous fiscal year, foreign exchange gains
totaled ¥39.2 billion (U.S.$381 million), leading to an ordinary income of ¥6.0 billion (U.S.$59 million; a
decrease of 41.9% on a year-on-year basis). On the other hand, mainly due to the balance of deferred tax assets
reduced in relation to the losses carried over in the United States, there is a net loss of ¥23.2 billion (U.S.$225
million; compared with a net income of ¥7.0 billion in the previous fiscal year).
Segment information is omitted as Nintendo operates as a single business segment.
(2) Cash flow
The ending balance of “Cash and cash equivalents” (collectively, “Cash”) as of March 31, 2014 was ¥341.2
billion (U.S.$3,313 million), with a decrease of ¥128.1 billion during the fiscal year. During the previous fiscal
year, there was an increase of ¥62.2 billion. Net increase (decrease) of Cash and contributing factors during the
fiscal year ended March 31, 2014 are as follows:
Net cash provided by (used in) operating activities:
While there were increasing factors from settlements of notes and accounts receivable - trade, due to a decrease
of notes and accounts payable - trade, net cash resulted in a decrease of ¥23.1 billion (U.S.$224 million)
compared to a decrease of ¥40.3 billion in the previous fiscal year.
Net cash provided by (used in) investing activities:
Net cash from investing activities decreased by ¥20.0 billion (U.S.$194 million) compared to an increase of
¥89.1 billion in the previous fiscal year mainly due to purchases of property, plant and equipment as well as
intangible assets pertaining to the construction of the Development Center.
Net cash provided by (used in) financing activities:
Net cash from financing activities decreased by ¥127.1 billion (U.S.$1,234 million) compared to a decrease of
¥12.8 billion in the previous fiscal year mainly due to the acquisition of treasury shares.