Nintendo 2014 Annual Report Download - page 3
Download and view the complete annual report
Please find page 3 of the 2014 Nintendo annual report below. You can navigate through the pages in the report by either clicking on the pages listed below, or by using the keyword search tool below to find specific information within the annual report.-
 1
1 -
 2
2 -
 3
3 -
 4
4 -
 5
5 -
 6
6 -
 7
7 -
 8
8 -
 9
9 -
 10
10 -
 11
11 -
 12
12 -
 13
13 -
 14
14 -
15
-
16
-
17
-
18
-
19
-
20
-
21
-
22
-
23
-
24
-
25
-
26
-
27
-
28
-
29
-
30
-
31
-
32
-
33
-
34
-
35
-
36
-
37
-
38
-
39
-
40
-
41
-
42
-
43
-
44
-
45
-
46
-
47
-
48
-
49
-
50
-
51
 |
 |

- 1 -
Information on the Company
I. Overview of the Company
1. Key financial data and trends
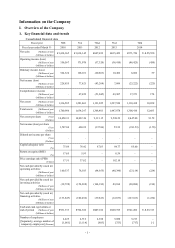
Consolidated financial data
Fiscal year 70th 71st 72nd 73rd 74th
Fiscal year ended March 31 2010 2011 2012 2013 2014
Net sales (Millions of yen)
(Millions of dollars) ¥1,434,365 ¥1,014,345 ¥647,652 ¥635,422 ¥571,726 U.S.$5,550
Operating income (loss)
(Millions of yen)
(Millions of dollars)
356,567 171,076 (37,320) (36,410) (46,425) (450)
Ordinary income (loss)
(Millions of yen)
(Millions of dollars)
364,324 128,101 (60,863) 10,482 6,086 59
Net income (loss)
(Millions of yen)
(Millions of dollars)
228,635 77,621 (43,204) 7,099 (23,222) (225)
Comprehensive income
(Millions of yen)
(Millions of dollars)
– 47,659 (51,045) 49,307 17,971 174
Net assets (Millions of yen)
(Millions of dollars) 1,336,585 1,281,861 1,191,025 1,227,520 1,118,438 10,858
Total assets (Millions of yen)
(Millions of dollars) 1,760,986 1,634,297 1,368,401 1,447,878 1,306,410 12,683
Net assets per share (Yen)
(Dollars) 10,450.33 10,022.26 9,313.15 9,598.22 9,447.00 91.72
Net income (loss) per share
(Yen)
(Dollars)
1,787.84 606.99 (337.86) 55.52 (183.59) (1.78)
Diluted net income per share
(Yen)
(Dollars)
– – – – – –
Capital adequacy ratio
(%) 75.89 78.42 87.03 84.77 85.60 –
Return on equity (ROE)
(%) 17.65 5.93 – 0.59 – –
Price earnings ratio (PER)
(Times) 17.51 37.02 – 182.10 – –
Net cash provided by (used in)
operating activities
(Millions of yen)
(Millions of dollars)
160,337 78,103 (94,955) (40,390) (23,114) (224)
Net cash provided by (used in)
investing activities
(Millions of yen)
(Millions of dollars)
(12,728) (154,038) (164,392) 89,104 (20,084) (194)
Net cash provided by (used in)
financing activities
(Millions of yen)
(Millions of dollars)
(133,847) (102,456) (39,823) (12,873) (127,163) (1,234)
Cash and cash equivalents at
end of period (Millions of yen)
(Millions of dollars)
¥931,333 ¥724,366 ¥407,186 ¥469,395 ¥341,266 U.S.$3,313
Number of employees
[Separately, average number of
temporary employees] (Persons)
4,425
[1,081]
4,712
[1,114]
4,928
[803]
5,080
[753]
5,213
[717]
–
[–]