Nintendo 2008 Annual Report Download - page 9
Download and view the complete annual report
Please find page 9 of the 2008 Nintendo annual report below. You can navigate through the pages in the report by either clicking on the pages listed below, or by using the keyword search tool below to find specific information within the annual report.-
 1
1 -
 2
2 -
 3
3 -
 4
4 -
 5
5 -
 6
6 -
 7
7 -
 8
8 -
 9
9 -
 10
10 -
 11
11 -
 12
12 -
 13
13 -
 14
14 -
 15
15 -
 16
16 -
 17
17 -
 18
18 -
 19
19 -
 20
20 -
21
-
22
-
23
-
24
-
25
-
26
-
27
-
28
-
29
-
30
-
31
-
32
-
33
-
34
-
35
-
36
-
37
-
38
-
39
-
40
-
41
-
42
-
43
-
44
-
45
-
46
-
47
-
48
-
49
-
50
 |
 |

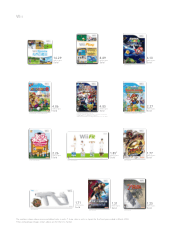
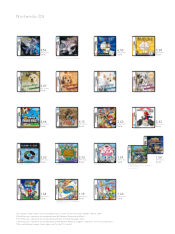
The numbers shown above are consolidated sales in units (* show sales in units in Japan) for the fiscal year ended in March, 2008.
Titles and package images shown above are for the U.S. market.
©2006 2007 Nintendo ©2007 N ntendo
8.89
Sold
million pcs.
6.10
Sold
million pcs.
16.29
Sold
million pcs.
4.85
Sold
million pcs.
2.27
Sold
million pcs.
1.85*
Sold
million pcs.
1.77
Sold
million pcs.
1.31
Sold
million pcs.
1.25
Sold
million pcs.
1.71
Sold
million pcs.
©2006 Nintendo
©2007 Nintendo
© 2008 Nintendo /HAL Laboratory Inc
Characters: © Nintendo /HAL Laboratory Inc /Pokémon /Creatures Inc
/ GAME FREAK nc / SHIGESATO ITOI / APE inc /
INTELLIGENT SYSTEMS / Konami Digital Entertainment Co Ltd /SEGA
4.86
Sold
million pcs.
© 2007 Nintendo © 2007 HUDSON SOFT © 2007 Nintendo/INTELLIGENT SYSTEMS
©2007 2008 Nintendo
2.26
Sold
million pcs.
© 2005 2006 Nintendo ©2007 N ntendo
©2007 Nintendo ©2006 N ntendo
W i i