Nikon 2002 Annual Report Download - page 15
Download and view the complete annual report
Please find page 15 of the 2002 Nikon annual report below. You can navigate through the pages in the report by either clicking on the pages listed below, or by using the keyword search tool below to find specific information within the annual report.-
 1
1 -
2
-
3
-
4
-
 5
5 -
 6
6 -
 7
7 -
 8
8 -
 9
9 -
 10
10 -
 11
11 -
 12
12 -
 13
13 -
 14
14 -
 15
15 -
 16
16 -
 17
17 -
 18
18 -
 19
19 -
 20
20 -
 21
21 -
 22
22 -
 23
23 -
 24
24 -
 25
25 -
26
-
27
-
28
-
29
-
30
-
31
-
32
-
33
-
34
-
35
-
36
-
37
-
38
-
39
-
40
-
41
-
42
 |
 |

13
OPERATING ENVIRONMENT
In the fiscal year ended March 31, 2002, strong consumer spending helped support the U.S. economy amid fears that the terrorist attacks would
prompt a sharper slowdown. Signs emerged by the end of the year that the economy had bottomed and was already recovering. In Europe, howev-
er, recessionary trends intensified as both exports and capital investment faltered. Economic growth was also weak overall in Asia.
In Japan, consumer spending remained lackluster, while capital investment tumbled sharply. Harsh business conditions prevailed as the econo-
my tipped back into recession.
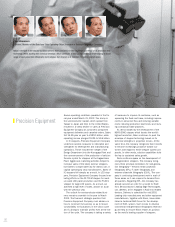
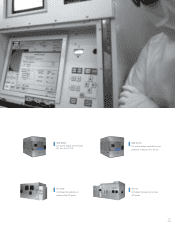
An unprecedented slump in the market for semiconductors impacted both the Precision Equipment and Instruments of the Nikon Group busi-
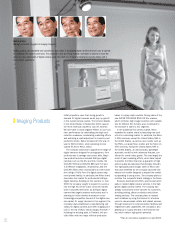
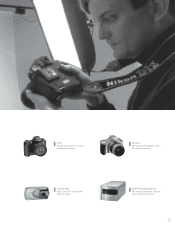
ness. Exceptionally poor business conditions prevailed as the market underwent widespread structural changes. In contrast, the Imaging Products
benefited as the digital camera market continued to expand briskly.
Net Sales by Industry Segment
Years ended March 31, 2002 and 2001 Thousands of
Millions of Yen, % U.S. Dollars
2002 2001 2002
Precision Equipment ¥198,991 ¥234,808 $1,493,369
Share of net sales 41.2% 48.5%
Imaging Products 221,577 180,112 1,662,870
Share of net sales 45.9 37.2
Instruments 46,641 59,008 350,028
Share of net sales 9.6 12.2
Other 48,176 43,610 361,545
Share of net sales 10.0 9.0
Total ¥515,385 ¥517,538 $3,867,812
(Elimination) (32,410) (33,581) (243,230)
(6.7) (6.9)
Consolidated ¥482,975 ¥483,957 $3,624,582
Thousands of
Millions of Yen U.S. Dollars
2002 2001 2000 1999 1998 2002
For the year
Net sales ¥482,975 ¥483,957 ¥371,801 ¥ 305,765 ¥ 372,146 $3,624,582
Cost of sales 306,793 301,759 247,473 205,984 224,546 2,302,387
SG&A expenses 153,943 120,775 105,894 108,522 120,123 1,155,295
Operating income (loss) 22,239 61,423 18,434 (8,741 ) 27,477 166,900
Income (loss) before income taxes and minority interest 2,755 29,827 11,479 (17,447 ) 18,929 20,678
Net income (loss) (6,004) 20,911 7,770 (18,233 ) 8,318 (45,056)
Per share of common stock (Yen and U.S. dollars):
Net income (loss) ¥(16.23) ¥56.53 ¥ 21.01 ¥ (49.29 ) ¥ 22.48 $(0.12)
Cash dividends applicable to the year 4.00 8.00 5.00 3.00 8.00 0.03
Capital expenditures ¥33,546 ¥25,996 ¥ 13,881 ¥ 20,719 ¥ 26,168 $251,749
Depreciation and amortization 17,917 16,007 17,251 20,110 18,407 134,463
R&D costs 27,313 22,794 17,798 18,729 21,633 204,977
At year-end
Total assets ¥561,276 ¥593,454 ¥502,175 ¥ 474,965 ¥ 507,326 $4,212,202
Shareholders' equity 176,961 186,119 166,495 160,991 171,051 1,328,036
Notes: 1. Per share of common stock is computed based on the weighted average number of shares outstanding during the year.
2. U.S. dollar figures are translated for reference only at ¥133.25 to U.S. $1.00, the exchange rate at March 31, 2002.
Five-Year Summary
Management’s Discussion and Analysis of Operations
Nikon Corporation and Consolidated Subsidiaries
Years ended March 31