McKesson 2014 Annual Report Download - page 2
Download and view the complete annual report
Please find page 2 of the 2014 McKesson annual report below. You can navigate through the pages in the report by either clicking on the pages listed below, or by using the keyword search tool below to find specific information within the annual report.-
 1
1 -
 2
2 -
 3
3 -
 4
4 -
 5
5 -
 6
6 -
 7
7 -
 8
8 -
 9
9 -
 10
10 -
 11
11 -
 12
12 -
 13
13 -
14
-
15
-
16
-
17
-
18
-
19
-
20
-
21
-
22
-
23
-
24
-
25
-
26
-
27
-
28
-
29
-
30
-
31
-
32
-
33
-
34
-
35
-
36
-
37
-
38
-
39
-
40
-
41
-
42
-
43
-
44
-
45
-
46
-
47
-
48
-
49
-
50
-
51
-
52
-
53
-
54
-
55
-
56
-
57
-
58
-
59
-
60
-
61
-
62
-
63
-
64
-
65
-
66
-
67
-
68
-
69
-
70
-
71
-
72
-
73
-
74
-
75
-
76
-
77
-
78
-
79
-
80
-
81
-
82
-
83
-
84
-
85
-
86
-
87
-
88
-
89
-
90
-
91
-
92
-
93
-
94
-
95
-
96
-
97
-
98
-
99
-
100
-
101
-
102
-
103
-
104
-
105
-
106
-
107
-
108
-
109
-
110
-
111
-
112
-
113
-
114
-
115
-
116
-
117
-
118
-
119
-
120
-
121
-
122
-
123
-
124
-
125
-
126
-
127
-
128
-
129
-
130
-
131
-
132
-
133
 |
 |

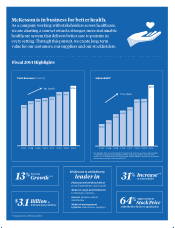
Total Revenue (in billions) Adjusted EPS*
FY07 FY08 FY09 FY10 FY11 FY12 FY13 FY14
$2.81
$3.41
$4.23
$4.65
$5.13
$6.28 $6.38
$8.35
17% CAGR
McKesson is an industry
leader in
· Pharmaceutical distribution
in the United States and Canada
· Medical-surgical distribution
to alternate care sites
· Generic pharmaceutical
distribution
· Medical-management
software and services to payers
FY07 FY08 FY09 FY10 FY11 FY12 FY13 FY14
5% CAGR
$93
$101
$106 $108 $112
$122 $122
$138
*See Appendix A to this 2014 Annual Report for a reconciliation of earnings per share as reported under
U.S. generally accepted accounting principles (“GAAP”) to adjusted earnings per share. Non-GAAP
measure such as adjusted earnings per share should be viewed in addition to, and not as an alternative for,
financial results prepared in accordance with GAAP.
McKesson is in business for better health.
As a company working with stakeholders across healthcare,
we are charting a course toward a stronger, more sustainable
healthcare system that delivers better care to patients in
every setting. Through this pursuit, we create long-term
value for our customers, our suppliers and our stockholders.
Billion in
2014 Operating Cash Flow
Appreciation in
Stock Price
13%Revenue
Growth
64%
Increase
in Adjusted EPS
31%
Fiscal 2014 Highlights
**Increase from fiscal 2013 to fiscal 2014
$3.1
**
**
Added $16B to Market Capitalization