MasterCard 2008 Annual Report Download - page 73
Download and view the complete annual report
Please find page 73 of the 2008 MasterCard annual report below. You can navigate through the pages in the report by either clicking on the pages listed below, or by using the keyword search tool below to find specific information within the annual report.-
 1
1 -
2
-
3
-
4
-
5
-
6
-
7
-
8
-
9
-
10
-
11
-
12
-
13
-
14
-
15
-
16
-
17
-
18
-
19
-
20
-
21
-
22
-
23
-
24
-
25
-
26
-
27
-
28
-
29
-
30
-
31
-
32
-
33
-
34
-
35
-
36
-
37
-
38
-
39
-
40
-
41
-
42
-
43
-
44
-
45
-
46
-
47
-
48
-
49
-
50
-
51
-
52
-
53
-
54
-
55
-
56
-
57
-
58
-
59
-
60
-
61
-
62
-
 63
63 -
 64
64 -
 65
65 -
 66
66 -
 67
67 -
 68
68 -
 69
69 -
 70
70 -
 71
71 -
 72
72 -
 73
73 -
 74
74 -
 75
75 -
 76
76 -
 77
77 -
 78
78 -
 79
79 -
 80
80 -
 81
81 -
 82
82 -
 83
83 -
84
-
85
-
86
-
87
-
88
-
89
-
90
-
91
-
92
-
93
-
94
-
95
-
96
-
97
-
98
-
99
-
100
-
101
-
102
-
103
-
104
-
105
-
106
-
107
-
108
-
109
-
110
-
111
-
112
-
113
-
114
-
115
-
116
-
117
-
118
-
119
-
120
-
121
-
122
-
123
-
124
-
125
-
126
-
127
-
128
-
129
-
130
-
131
-
132
-
133
-
134
-
135
-
136
-
137
-
138
-
139
-
140
-
141
-
142
-
143
-
144
-
145
-
146
-
147
-
148
-
149
-
150
-
151
-
152
-
153
-
154
-
155
-
156
-
157
-
158
-
159
-
160
 |
 |

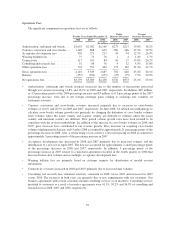
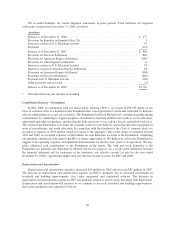
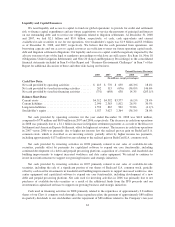
Liquidity and Capital Resources
We need liquidity and access to capital to fund our global operations; to provide for credit and settlement
risk; to finance capital expenditures and any future acquisitions; to service the payments of principal and interest
on our outstanding debt; and to service our obligations related to litigation settlements. At December 31, 2008
and 2007, we had $2.1 billion and $3.0 billion, respectively, of cash, cash equivalents and current
available-for-sale securities to use for our operations. Our stockholder’s equity was $1.9 billion and $3.0 billion
as of December 31, 2008, and 2007, respectively. We believe that the cash generated from operations, our
borrowing capacity and our access to capital resources are sufficient to meet our future operating capital needs,
debt and litigation settlement obligations. Our liquidity and access to capital could be negatively impacted by the
adverse outcome of any of the legal or regulatory proceedings to which we are still a party. See Item 1A, Note 18
(Obligations Under Litigation Settlements) and Note 20 (Legal and Regulatory Proceedings) to the consolidated
financial statements included in Item 8 of this Report and “-Business Environment Challenges” in Item 7 of this
Report for additional discussion of these and other risks facing our business.
2008 2007 2006
Percent Increase (Decrease)
2008 2007
(In millions, except percentages)
Cash Flow Data:
Net cash provided by operating activities .............. $ 413 $ 770 $ 650 (46.3)% 18.4%
Net cash provided by (used in) investing activities ....... 202 315 (676) (36.0)% 146.6%
Net cash provided by (used in) financing activities ....... (751) (658) 638 14.3% (203.1)%
Balance Sheet Data:
Current assets .................................... $4,312 $4,592 $3,577 (6.1)% 28.4%
Current liabilities ................................. 2,990 2,363 1,812 26.5% 30.5%
Long-term liabilities ............................... 1,553 865 902 79.6% (4.1)%
Stockholder’s equity ............................... 1,927 3,027 2,364 (36.3)% 28.0%
Net cash provided by operating activities for the year ended December 31, 2008 was $413 million,
compared to $770 million and $650 million in 2007 and 2006, respectively. The decrease in cash from operations
in 2008 was primarily due to a $1.1 billion increase in litigation settlement payments as a result of the Discover
Settlement and American Express Settlement, offset by higher net revenues. The increase in cash from operations
in 2007 versus 2006 was primarily due to higher net income less the realized pre-tax gain on RedeCard S.A.
common stock, which is classified as an investing activity, partially offset by higher income tax payments,
including approximately $137 million for taxes relating to the realized gain on RedeCard S.A. common stock.
Net cash provided by investing activities in 2008 primarily related to net sales of available-for-sale
securities, partially offset by payments for capitalized software to expand our core functionality, including
continued development of a debit and prepaid processing platform, acquisition of a business, and leasehold and
building improvements to support increased workforce and data center equipment. We intend to continue to
invest in our infrastructure to support our growing business and strategic initiatives.
Net cash provided by investing activities in 2007 primarily related to net sales of available-for-sale
securities, including the sale of a significant portion of our shares of Redecard S.A. common stock, partially
offset by cash used for investments in leasehold and building improvements to support increased workforce, data
center equipment and capitalized software to expand our core functionality, including development of a new
debit and prepaid processing platform. Net cash used for investing activities in 2006 was primarily due to net
purchases of available-for-sale-securities as a result of the additional funds from the IPO proceeds and our
investment in capitalized software to support our growing business and strategic initiatives.
Cash used in financing activities in 2008 primarily related to the repurchase of approximately 2.8 million
shares of our Class A common stock through a share repurchase plan, the payment of approximately $80 million
in quarterly dividends to our stockholders and the repayment of $80 million related to the Company’s ten-year
63