Lenovo 2009 Annual Report Download - page 80
Download and view the complete annual report
Please find page 80 of the 2009 Lenovo annual report below. You can navigate through the pages in the report by either clicking on the pages listed below, or by using the keyword search tool below to find specific information within the annual report.-
 1
1 -
2
-
3
-
4
-
5
-
6
-
7
-
8
-
9
-
10
-
11
-
12
-
13
-
14
-
15
-
16
-
17
-
18
-
19
-
20
-
21
-
22
-
23
-
24
-
25
-
26
-
27
-
28
-
29
-
30
-
31
-
32
-
33
-
34
-
35
-
36
-
37
-
38
-
39
-
40
-
41
-
42
-
43
-
44
-
45
-
46
-
47
-
48
-
49
-
50
-
51
-
52
-
53
-
54
-
55
-
56
-
57
-
58
-
59
-
60
-
61
-
62
-
63
-
64
-
65
-
66
-
67
-
68
-
69
-
 70
70 -
 71
71 -
 72
72 -
 73
73 -
 74
74 -
 75
75 -
 76
76 -
 77
77 -
 78
78 -
 79
79 -
 80
80 -
 81
81 -
 82
82 -
 83
83 -
 84
84 -
 85
85 -
 86
86 -
 87
87 -
 88
88 -
 89
89 -
 90
90 -
91
-
92
-
93
-
94
-
95
-
96
-
97
-
98
-
99
-
100
-
101
-
102
-
103
-
104
-
105
-
106
-
107
-
108
-
109
-
110
-
111
-
112
-
113
-
114
-
115
-
116
-
117
-
118
-
119
-
120
-
121
-
122
-
123
-
124
-
125
-
126
-
127
-
128
-
129
-
130
-
131
-
132
-
133
-
134
-
135
-
136
-
137
-
138
-
139
-
140
-
141
-
142
-
143
-
144
-
145
-
146
-
147
-
148
-
149
-
150
-
151
-
152
-
153
-
154
-
155
-
156
 |
 |

2008/09 Annual Report Lenovo Group Limited
78
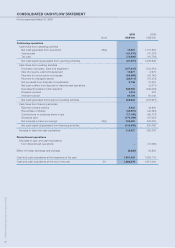
CONSOLIDATED CASH FLOW STATEMENT
For the year ended March 31, 2009
2009 2008
Note US$’000 US$’000
Continuing operations
Cash flows from operating activities
Net cash generated from operations 36(a) 19,961 1,131,804
Interest paid (41,976) (41,197)
Tax paid (75,292) (81,759)
Net cash (used in)/generated from operating activities (97,307) 1,008,848
Cash flows from investing activities
Purchase of property, plant and equipment (107,016) (124,561)
Sale of property, plant and equipment 10,671 4,975
Payment for construction-in-progress (63,988) (67,142)
Payment for intangible assets (22,911) (75,575)
Net proceeds from disposal of investments 9,788 13,523
Net cash outflow from disposal of discontinued operations – (5,371)
Decrease/(increase) in bank deposits 540,058 (540,058)
Dividend received 1,515 223
Interest received 64,126 60,049
Net cash generated from/(used in) investing activities 432,243 (733,937)
Cash flows from financing activities
Exercise of share options 9,433 34,829
Repurchase of shares (53,907) (42,583)
Contributions to employee share trusts (17,169) (63,177)
Dividends paid (179,159) (67,087)
Net increase in bank borrowings 36(b) 124,493 428,683
Net cash (used in)/generated from financing activities (116,309) 290,665
Increase in cash and cash equivalents 218,627 565,576
Discontinued operations
Decrease in cash and cash equivalents
from discontinued operations – (12,695)
Effect of foreign exchange rate changes (6,668) 34,823
Cash and cash equivalents at the beginning of the year 1,651,420 1,063,716
Cash and cash equivalents at the end of the year 26 1,863,379 1,651,420