Lenovo 2009 Annual Report Download - page 48
Download and view the complete annual report
Please find page 48 of the 2009 Lenovo annual report below. You can navigate through the pages in the report by either clicking on the pages listed below, or by using the keyword search tool below to find specific information within the annual report.-
 1
1 -
2
-
3
-
4
-
5
-
6
-
7
-
8
-
9
-
10
-
11
-
12
-
13
-
14
-
15
-
16
-
17
-
18
-
19
-
20
-
21
-
22
-
23
-
24
-
25
-
26
-
27
-
28
-
29
-
30
-
31
-
32
-
33
-
34
-
35
-
36
-
37
-
 38
38 -
 39
39 -
 40
40 -
 41
41 -
 42
42 -
 43
43 -
 44
44 -
 45
45 -
 46
46 -
 47
47 -
 48
48 -
 49
49 -
 50
50 -
 51
51 -
 52
52 -
 53
53 -
 54
54 -
 55
55 -
 56
56 -
 57
57 -
 58
58 -
59
-
60
-
61
-
62
-
63
-
64
-
65
-
66
-
67
-
68
-
69
-
70
-
71
-
72
-
73
-
74
-
75
-
76
-
77
-
78
-
79
-
80
-
81
-
82
-
83
-
84
-
85
-
86
-
87
-
88
-
89
-
90
-
91
-
92
-
93
-
94
-
95
-
96
-
97
-
98
-
99
-
100
-
101
-
102
-
103
-
104
-
105
-
106
-
107
-
108
-
109
-
110
-
111
-
112
-
113
-
114
-
115
-
116
-
117
-
118
-
119
-
120
-
121
-
122
-
123
-
124
-
125
-
126
-
127
-
128
-
129
-
130
-
131
-
132
-
133
-
134
-
135
-
136
-
137
-
138
-
139
-
140
-
141
-
142
-
143
-
144
-
145
-
146
-
147
-
148
-
149
-
150
-
151
-
152
-
153
-
154
-
155
-
156
 |
 |

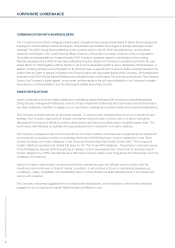
CORPORATE GOVERNANCE
2008/09 Annual Report Lenovo Group Limited
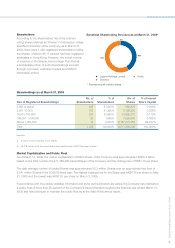
46
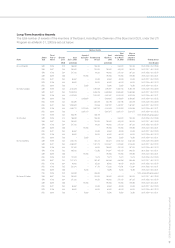
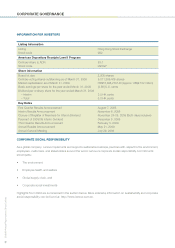
Number of units
Name
Award
Type
Fiscal
Year of
Award
Effective
price
As at
April 1, 2008
Awarded
during the
year
Vested during
the year
As at
March 31,
2009
Total
outstanding
as at March
31, 2009
Max no.
of shares
subject to
conditions Vesting period
(HK$) (unvested) (unvested) (mm.dd.yyyy)
Mr. William O. Grabe SAR 05/06 3.15 188,000 – 188,000 – 564,000 564,000 05.01.2006 - 05.01.2008
SAR 06/07 2.99 260,000 – 130,000 130,000 390,000 390,000 06.01.2007 - 06.01.2009
SAR 07/08 3.94 297,000 – 99,000 198,000 297,000 297,000 06.01.2008 - 06.01.2010
SAR 08/09 5.88 – 195,980 – 195,980 195,980 195,980 06.01.2009 - 06.01.2011
RSU 06/07 2.99 86,667 – 43,333 43,334 43,334 43,334 06.01.2007 - 06.01.2009
RSU 07/08 3.94 99,000 – 33,000 66,000 66,000 66,000 06.01.2008 - 06.01.2010
RSU 08/09 5.88 – 78,390 – 78,390 78,390 78,390 06.01.2009 - 06.01.2011
RSU 08/09 6.01 – 16,223 16,223 – – – Note 1
RSU 08/09 5.54 – 4,144 4,144 – – – Note 2
RSU 08/09 1.62 – 83,719 83,719 – – – Note 1
RSU 08/09 1.75 – 3,113 3,113 – – – Note 2
Professor Woo Chia-Wei SAR 05/06 3.15 188,000 – 188,000 – 564,000 564,000 05.01.2006 - 05.01.2008
SAR 06/07 2.99 260,000 – 130,000 130,000 390,000 390,000 06.01.2007 - 06.01.2009
SAR 07/08 3.94 297,000 – 99,000 198,000 297,000 297,000 06.01.2008 - 06.01.2010
SAR 08/09 5.88 – 195,980 – 195,980 195,980 195,980 06.01.2009 - 06.01.2011
RSU 06/07 2.99 86,667 – 43,333 43,334 43,334 43,334 06.01.2007 - 06.01.2009
RSU 07/08 3.94 99,000 – 33,000 66,000 66,000 66,000 06.01.2008 - 06.01.2010
RSU 08/09 5.88 – 78,390 – 78,390 78,390 78,390 06.01.2009 - 06.01.2011
RSU 08/09 6.01 – 12,978 12,978 – – – Note 1
RSU 08/09 5.54 – 3,486 3,486 – – – Note 2
RSU 08/09 1.62 – 71,759 71,759 – – – Note 1
RSU 08/09 1.75 – 2,666 2,666 – – – Note 2
Mr. Ting Lee Sen SAR 05/06 3.15 188,000 – 188,000 – 564,000 564,000 05.01.2006 - 05.01.2008
SAR 06/07 2.99 260,000 – 130,000 130,000 390,000 390,000 06.01.2007 - 06.01.2009
SAR 07/08 3.94 297,000 – 99,000 198,000 297,000 297,000 06.01.2008 - 06.01.2010
SAR 08/09 5.88 – 195,980 – 195,980 195,980 195,980 06.01.2009 - 06.01.2011
RSU 06/07 2.99 86,667 – 43,333 43,334 43,334 43,334 06.01.2007 - 06.01.2009
RSU 07/08 3.94 99,000 – 33,000 66,000 66,000 66,000 06.01.2008 - 06.01.2010
RSU 08/09 5.88 – 78,390 – 78,390 78,390 78,390 06.01.2009 - 06.01.2011
RSU 08/09 6.01 – 12,978 12,978 – – – Note 1
RSU 08/09 5.54 – 3,486 3,486 – – – Note 2
RSU 08/09 1.62 – 71,759 71,759 – – – Note 1
RSU 08/09 1.75 – 2,666 2,666 – – – Note 2
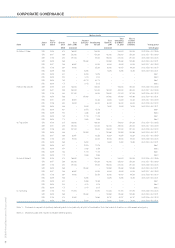
Mr. John W. Barter III SAR 05/06 3.15 188,000 – 188,000 – 564,000 564,000 05.01.2006 - 05.01.2008
SAR 06/07 2.99 260,000 – 130,000 130,000 390,000 390,000 06.01.2007 - 06.01.2009
SAR 07/08 3.94 297,000 – 99,000 198,000 297,000 297,000 06.01.2008 - 06.01.2010
SAR 08/09 5.88 – 195,980 – 195,980 195,980 195,980 06.01.2009 - 06.01.2011
RSU 06/07 2.99 86,667 – 43,333 43,334 43,334 43,334 06.01.2007 - 06.01.2009
RSU 07/08 3.94 99,000 – 33,000 66,000 66,000 66,000 06.01.2008 - 06.01.2010
RSU 08/09 5.88 – 78,390 – 78,390 78,390 78,390 06.01.2009 - 06.01.2011
RSU 08/09 6.01 – 19,468 19,468 – – – Note 1
RSU 08/09 5.54 – 4,076 4,076 – – – Note 2
RSU 08/09 1.75 – 3,115 3,115 – – – Note 2
Dr. Tian Suning SAR 07/08 5.14 151,950 – 50,650 101,300 151,950 151,950 09.01.2008 - 09.01.2010
SAR 08/09 5.88 – 195,980 – 195,980 195,980 195,980 06.01.2009 - 06.01.2011
RSU 07/08 5.14 50,650 – 16,883 33,767 33,767 33,767 09.01.2008 - 09.01.2010
RSU 08/09 5.88 – 78,390 – 78,390 78,390 78,390 06.01.2009 - 06.01.2011
Note 1: Proceeds in respect of quarterly deferral grants to be paid only at point of termination from the board of directors or unforeseen emergency.
Note 2: Dividends paid with respect to eligible deferral grants.