Kodak 2009 Annual Report Download - page 34
Download and view the complete annual report
Please find page 34 of the 2009 Kodak annual report below. You can navigate through the pages in the report by either clicking on the pages listed below, or by using the keyword search tool below to find specific information within the annual report.-
 1
1 -
2
-
3
-
4
-
5
-
6
-
7
-
8
-
9
-
10
-
11
-
12
-
13
-
14
-
15
-
16
-
17
-
18
-
19
-
20
-
21
-
22
-
23
-
 24
24 -
 25
25 -
 26
26 -
 27
27 -
 28
28 -
 29
29 -
 30
30 -
 31
31 -
 32
32 -
 33
33 -
 34
34 -
 35
35 -
 36
36 -
 37
37 -
 38
38 -
 39
39 -
 40
40 -
 41
41 -
 42
42 -
 43
43 -
 44
44 -
45
-
46
-
47
-
48
-
49
-
50
-
51
-
52
-
53
-
54
-
55
-
56
-
57
-
58
-
59
-
60
-
61
-
62
-
63
-
64
-
65
-
66
-
67
-
68
-
69
-
70
-
71
-
72
-
73
-
74
-
75
-
76
-
77
-
78
-
79
-
80
-
81
-
82
-
83
-
84
-
85
-
86
-
87
-
88
-
89
-
90
-
91
-
92
-
93
-
94
-
95
-
96
-
97
-
98
-
99
-
100
-
101
-
102
-
103
-
104
-
105
-
106
-
107
-
108
-
109
-
110
-
111
-
112
-
113
-
114
-
115
-
116
-
117
-
118
-
119
-
120
-
121
-
122
-
123
-
124
-
125
-
126
-
127
-
128
-
129
-
130
-
131
-
132
-
133
-
134
-
135
-
136
-
137
-
138
-
139
-
140
-
141
-
142
-
143
-
144
-
145
-
146
-
147
-
148
-
149
-
150
-
151
-
152
-
153
-
154
-
155
-
156
-
157
-
158
-
159
-
160
-
161
-
162
-
163
-
164
-
165
-
166
-
167
-
168
-
169
-
170
-
171
-
172
-
173
-
174
-
175
-
176
-
177
-
178
-
179
-
180
-
181
-
182
-
183
-
184
-
185
-
186
-
187
-
188
-
189
-
190
-
191
-
192
-
193
-
194
-
195
-
196
-
197
-
198
-
199
-
200
-
201
-
202
-
203
-
204
-
205
-
206
-
207
-
208
-
209
-
210
-
211
-
212
-
213
-
214
-
215
-
216
-
217
-
218
-
219
-
220
-
221
-
222
-
223
-
224
-
225
-
226
-
227
-
228
-
229
-
230
-
231
-
232
-
233
-
234
-
235
-
236
-
237
-
238
-
239
-
240
-
241
-
242
-
243
-
244
-
245
-
246
-
247
-
248
-
249
-
250
-
251
-
252
-
253
-
254
-
255
-
256
-
257
-
258
-
259
-
260
-
261
-
262
-
263
-
264
 |
 |
32
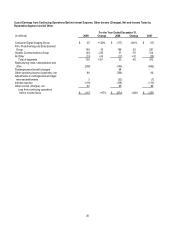
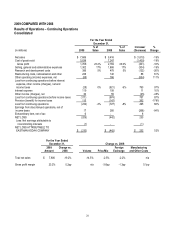
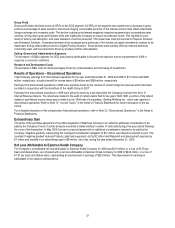
Revenues
For the year ended December 31, 2009, net sales decreased compared with 2008 primarily due to volume declines within all three
segments driven by lower demand likely as a result of the global economic slowdown which began in the fourth quarter of 2008,
particularly within Digital Capture and Devices in the CDG segment and Prepress Solutions in the GCG segment, as well as
continued secular declines in Traditional Photofinishing and Film Capture in the FPEG segment. Foreign exchange negatively
impacted sales across all three segments, due to a stronger U.S. dollar. Unfavorable price/mix was primarily driven by Digital
Capture and Devices within CDG, Entertainment Imaging within FPEG, and Prepress Solutions within GCG.
Gross Profit
Gross profit dollars declined in 2009, primarily due to unfavorable price/mix, which impacted all segments but was most prominent in
CDG, lower sales volumes as discussed above, and unfavorable foreign exchange. These items were partially offset by cost
improvements, largely driven by ongoing cost reduction efforts within CDG and FPEG, and lower benefit costs as a result of
amendments made in the third quarter of 2008 to certain of the Company’s U.S. postemployment benefit plans. Gross profit margin
as a percentage of sales increased slightly from prior year, as unfavorable price/mix (primarily within CDG) and unfavorable foreign
exchange impacts (across all segments) were more than offset by lower manufacturing and other costs for the Company.
Included in gross profit for the current year were non-recurring intellectual property licensing agreements within Digital Capture and
Devices in the CDG segment. These licensing agreements contributed approximately 5.7% of consolidated revenue to consolidated
gross profit dollars in 2009, as compared with 2.4% of consolidated revenue to consolidated gross profit dollars for non-recurring
agreements in 2008. The Company expects to secure other new licensing agreements, the timing and amounts of which are difficult
to predict. These types of arrangements provide the Company with a return on portions of its R&D investments, and new licensing
opportunities are expected to have a continuing impact on the results of operations.
Selling, General and Administrative Expenses
The decrease in consolidated selling, general and administrative expenses (SG&A) was a result of company-wide cost reduction
actions implemented in 2009 in response to current economic conditions.
Research and Development Costs
The decrease in consolidated research and development (R&D) costs was a result of focused cost reduction efforts.
Restructuring Costs, Rationalization and Other
These costs, as well as the restructuring and rationalization-related costs reported in cost of goods sold, are discussed under the
"Restructuring Costs, Rationalization and Other" section.
Other Operating (Income) Expenses, Net
The other operating (income) expenses, net category includes gains and losses on sales of assets and businesses and certain
impairment charges. The current year amount primarily reflects a gain of approximately $100 million on the sale of assets of the
Company’s organic light emitting diodes (OLED) group. The prior year amount primarily reflects a $785 million goodwill impairment
charge related to the GCG business.
In November 2009, the Company agreed to terminate its patent infringement litigation with LG Electronics, Inc., LG Electronics USA,
Inc., and LG Electronics Mobilecomm USA, Inc., entered into a technology cross license agreement with LG Electronics, Inc. and
agreed to sell assets of its OLED group to Global OLED Technology LLC, an entity established by LG Electronics, Inc., LG Display
Co., Ltd. and LG Chem, Ltd. As the transactions were entered into in contemplation of one another, in order to reflect the asset sale
separately from the licensing transaction, the total consideration was allocated between the asset sale and the licensing transaction
based on the estimated fair value of the assets sold. Fair value of the assets sold was estimated using other competitive bids
received by the Company. Accordingly, $100 million of the proceeds was allocated to the asset sale. The remaining gross proceeds
of $414 million were allocated to the licensing transaction and reported in net sales of the CDG segment.