Kodak 2006 Annual Report Download - page 118
Download and view the complete annual report
Please find page 118 of the 2006 Kodak annual report below. You can navigate through the pages in the report by either clicking on the pages listed below, or by using the keyword search tool below to find specific information within the annual report.-
 1
1 -
2
-
3
-
4
-
5
-
6
-
7
-
8
-
9
-
10
-
11
-
12
-
13
-
14
-
15
-
16
-
17
-
18
-
19
-
20
-
21
-
22
-
23
-
24
-
25
-
26
-
27
-
28
-
29
-
30
-
31
-
32
-
33
-
34
-
35
-
36
-
37
-
38
-
39
-
40
-
41
-
42
-
43
-
44
-
45
-
46
-
47
-
48
-
49
-
50
-
51
-
52
-
53
-
54
-
55
-
56
-
57
-
58
-
59
-
60
-
61
-
62
-
63
-
64
-
65
-
66
-
67
-
68
-
69
-
70
-
71
-
72
-
73
-
74
-
75
-
76
-
77
-
78
-
79
-
80
-
81
-
82
-
83
-
84
-
85
-
86
-
87
-
88
-
89
-
90
-
91
-
92
-
93
-
94
-
95
-
96
-
97
-
98
-
99
-
100
-
101
-
102
-
103
-
104
-
105
-
106
-
107
-
 108
108 -
 109
109 -
 110
110 -
 111
111 -
 112
112 -
 113
113 -
 114
114 -
 115
115 -
 116
116 -
 117
117 -
 118
118 -
 119
119 -
 120
120 -
 121
121 -
 122
122 -
 123
123 -
 124
124 -
 125
125 -
 126
126 -
 127
127 -
 128
128 -
129
-
130
-
131
-
132
-
133
-
134
-
135
-
136
-
137
-
138
-
139
-
140
-
141
-
142
-
143
-
144
-
145
-
146
-
147
-
148
-
149
-
150
-
151
-
152
-
153
-
154
-
155
-
156
-
157
-
158
-
159
-
160
-
161
-
162
-
163
-
164
-
165
-
166
-
167
-
168
-
169
-
170
-
171
-
172
-
173
-
174
-
175
-
176
-
177
-
178
-
179
-
180
-
181
-
182
-
183
-
184
-
185
-
186
-
187
-
188
-
189
-
190
-
191
-
192
-
193
-
194
-
195
-
196
-
197
-
198
-
199
-
200
-
201
-
202
-
203
-
204
-
205
-
206
-
207
-
208
-
209
-
210
-
211
-
212
-
213
-
214
-
215
-
216
-
217
-
218
-
219
-
220
-
221
-
222
-
223
-
224
-
225
-
226
-
227
-
228
-
229
-
230
-
231
-
232
-
233
-
234
-
235
-
236
 |
 |

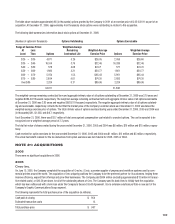
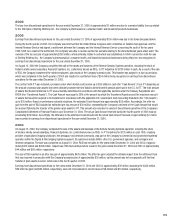
$50 million annually from 2008 through 2013. The total payments due under the U.S note and the non-U.S. note are $100 million and $400 million,
respectively. The aggregate fair value of these note payable arrangements of approximately $395 million was recorded in the Company’s Consolidated
Statement of Financial Position as of the acquisition date and was presented as a non-cash investing activity in the Consolidated Statement of Cash
Flows. KPG now operates within the Company’s Graphic Communications Group segment.
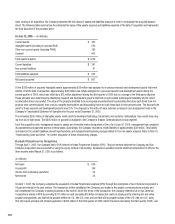
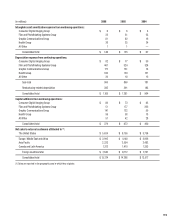
The following represents the total purchase price of the acquisition (in millions):
Cash paid at closing $ 317
Transaction costs 8
Notes payable 395
Total purchase price $ 720
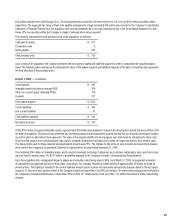
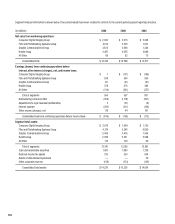
Upon closing of an acquisition, the Company estimates the fair values of assets and liabilities acquired in order to consolidate the acquired balance
sheet. The following table summarizes the estimated fair value of the assets acquired and liabilities assumed at the date of acquisition and represents
the final allocation of the purchase price.
At April 1, 2005 — (in millions):
Current assets $ 487
Intangible assets (including in-process R&D) 160
Other non-current assets (including PP&E) 179
Goodwill 237
Total assets acquired $ 1,063
Current liabilities $ 262
Non-current liabilities 81
Total liabilities assumed $ 343
Net assets acquired $ 720
Of the $160 million of acquired intangible assets, approximately $16 million was assigned to research and development assets that were written off at
the date of acquisition. This amount was determined by identifying research and development projects that had not yet reached technological feasibil-
ity and for which no alternative future uses exist. The value of the projects identified to be in progress was determined by estimating the future cash
flows from the projects once commercialized, less costs to complete development and discounting these net cash flows back to their present value.
The discount rate used for these research and development projects was 22%. The charges for the write-off were included as research and develop-
ment costs in the Company’s Consolidated Statement of Operations for the year ended December 31, 2005.
The remaining $144 million of intangible assets, which relate to developed technology, trademarks and customer relationships, have useful lives rang-
ing from three to sixteen years. The $237 million of goodwill is assigned to the Company’s Graphic Communications Group segment.
As of the acquisition date, management began to assess and formulate restructuring plans at KPG. As of March 31, 2006, management completed
its assessment and approved actions on these plans. Accordingly, the Company recorded a related liability of approximately $8 million on these ap-
proved actions. This liability is included in the current liabilities amount reported above and represents restructuring charges related to the net assets
acquired. To the extent such actions related to the Company’s historical ownership in the KPG joint venture, the restructuring charges were reflected in
the Company’s Consolidated Statement of Operations. Refer to Note 16, “Restructuring Costs and Other,” for further discussion of these restructuring
charges.