Kimberly-Clark 2008 Annual Report Download - page 5
Download and view the complete annual report
Please find page 5 of the 2008 Kimberly-Clark annual report below. You can navigate through the pages in the report by either clicking on the pages listed below, or by using the keyword search tool below to find specific information within the annual report.-
 1
1 -
 2
2 -
 3
3 -
 4
4 -
 5
5 -
 6
6 -
 7
7 -
 8
8 -
 9
9 -
 10
10 -
 11
11 -
 12
12 -
 13
13 -
 14
14 -
 15
15 -
 16
16 -
17
-
18
-
19
-
20
-
21
-
22
-
23
-
24
-
25
-
26
-
27
-
28
-
29
-
30
-
31
-
32
-
33
-
34
-
35
-
36
-
37
-
38
-
39
-
40
-
41
-
42
-
43
-
44
-
45
-
46
-
47
-
48
-
49
-
50
-
51
-
52
-
53
-
54
-
55
-
56
-
57
-
58
-
59
-
60
-
61
-
62
-
63
-
64
-
65
-
66
-
67
-
68
-
69
-
70
-
71
-
72
-
73
-
74
-
75
-
76
-
77
-
78
-
79
-
80
-
81
-
82
-
83
-
84
-
85
-
86
-
87
-
88
-
89
-
90
-
91
-
92
-
93
-
94
-
95
-
96
-
97
-
98
-
99
-
100
-
101
-
102
-
103
-
104
-
105
-
106
-
107
-
108
-
109
-
110
-
111
-
112
-
113
-
114
-
115
-
116
-
117
-
118
-
119
-
120
-
121
-
122
-
123
-
124
 |
 |

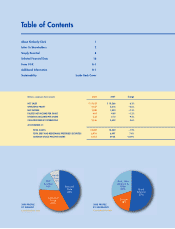
The strong innovation program and global rise in commodity prices allowed us to
achieve higher selling prices and better product mix. Net selling prices rose more
than 4 percent and mix improved almost 1 percent, representing the majority of
our 6 percent sales growth.
Our D&E businesses also produced excellent results, delivering double-digit sales
growth for the fifth consecutive year. Performance in the BRICIT (Brazil, Russia, India,
China, Indonesia, Turkey) countries outpaced established markets, with sales up
30 percent. That progress continues to drive our plans for future growth, as evidenced
by the scheduled 2009 start-up of our first manufacturing facility in Russia.
Total cost savings for the year were more than $170 million, somewhat below our
full-year objective of $200 million to $250 million. We over-delivered on the
strategic cost reduction plan, but savings from our ongoing FORCE (Focused on
Reducing Costs Everywhere) program were below expectations.
By year’s end, we completed the strategic cost reduction plan, which we began
in 2005. Cumulative annual cost savings totaled $335 million, putting us on
track to exceed our original commitment to save $300 million to $350 million by
2009. Moreover, the cost to implement the plan was below our initial forecast.
We controlled overhead spending tightly, with general and administrative
spending rising slower than sales in 2008. We will continue to closely manage
our overhead spending in 2009.
All these steps helped our businesses meet the day-to-day challenges of difficult
economic conditions, while we remained focused on the key capabilities critical
for our long-term growth.
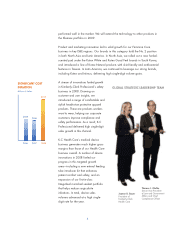
We made further progress in building our three key capability
areas: innovation, marketing and customer development.
Continuous Innovation During 2008, we took steps to better integrate our
innovation and marketing processes. That effort has led us to find new, more
effective ways to meet and exceed consumer expectations and deliver on the
promise of our brands.
For example, in North America, we strengthened our market-leading Kleenex
brand with the third-quarter rollout of a product improvement using proprietary
technology that increases softness while also improving strength. The first product
based on this technology—improved Kleenex Facial Tissue with Lotion—has
3
ORGANIC SALES
GROWING FASTER
THAN TARGET
Global Business Plan Target = 3–5%
2006 2007 2008
5.6%
4.5%
Organic sales growth
excludes currency impacts.
5.6%