KeyBank 2012 Annual Report Download - page 11
Download and view the complete annual report
Please find page 11 of the 2012 KeyBank annual report below. You can navigate through the pages in the report by either clicking on the pages listed below, or by using the keyword search tool below to find specific information within the annual report.-
 1
1 -
 2
2 -
 3
3 -
 4
4 -
 5
5 -
 6
6 -
 7
7 -
 8
8 -
 9
9 -
 10
10 -
 11
11 -
 12
12 -
 13
13 -
 14
14 -
 15
15
 |
 |

(a) See Notes to Consolidated Financial Statements in 2012 Annual Report on Form 10-K.
(b) The assets of the VIEs can only be used by the particular VIE and there is no recourse to Key with respect to the liabilities of the consolidated LIHTC or education loan securitization trust VIEs.
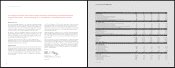
consolidated balance sheets(a)
Year ended December 31, (dollars in millions) 2012 2011
ASSETS
Cash and due from banks $585 $ 694
Short-term investments 3,940 3,519
Trading account assets 605 623
Securities available for sale 12,094 16,012
Held-to-maturity securities (fair value: $3,992 and $2,133) 3,931 2,10 9
Other investments 1,064 1,16 3
Loans, net of unearned income of $957 and $1,388 52,822 49,575
Less: Allowance for loan and lease losses 888 1,004
Net loans 51,934 48,571
Loans held for sale 599 728
Premises and equipment 965 944
Operating lease assets 288 350
Goodwill 979 917
Other intangible assets 171 17
Corporate-owned life insurance 3,333 3,256
Derivative assets 693 945
Accrued income and other assets (including $50 of consolidated LIHTC guaranteed funds VIEs, see Note 11)(b) 2,801 3,077
Discontinued assets (including $2,395 of consolidated education loan securitization trust VIEs at fair value, see Note 11)(b) 5,254 5,860
Total assets $ 89,236 $ 88,785
LIABILITIES
Deposits in domestic offices:
NOW and money market deposit accounts $32,380 $ 2 7, 9 5 4
Savings deposits 2,433 1,962
Certificates of deposit ($100,000 or more) 2,879 4,111
Other time deposits 4,575 6,243
Total interest-bearing deposits 42,267 40,270
Noninterest-bearing deposits 23,319 21,098
Deposits in foreign office — interest-bearing 407 588
Total deposits 65,993 61,956
Federal funds purchased and securities sold under repurchase agreements 1,609 1,711
Bank notes and other short-term borrowings 287 337
Derivative liabilities 584 1,026
Accrued expense and other liabilities 1,425 1,763
Long-term debt 6,847 9,520
Discontinued liabilities (including $2,181 of consolidated education loan securitization trust VIEs at fair value, see Note 11)(b) 2,182 2,550
Total liabilities 78,927 78,863
EQUITY
Preferred stock, $1 par value, authorized 25,000,000 shares:
7.75% Noncumulative Perpetual Convertible Preferred Stock, Series A, $100 liquidation
preference; authorized 7,475,000 shares; issued 2,904,839 and 2,904,839 shares 291 291
Common shares, $1 par value; authorized 1,400,000,000 shares; issued 1,016,969,905 and 1,016,969,905 shares 1,017 1,017
Capital surplus 4,126 4,19 4
Retained earnings 6,913 6,246
Treasury stock, at cost (91,201,285 and 63,962,113 shares) (1,952) (1,815)
Accumulated other comprehensive income (loss) (124) (28)
Key shareholders’ equity 10,271 9,905
Noncontrolling interests 38 17
Total equity 10,309 9,922
Total liabilities and equity $ 89,236 $ 88,785
18 19
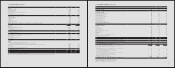
consolidated summary of income(a)
Year ended December 31, (dollars in millions, except per share amounts) 2012 2011 2010
Interest income $ 2,705 $2,889 $ 3,408
Interest expense 441 622 897
NET INTEREST INCOME 2,264 2,267 2,511
Provision for loan and lease losses 229 (60) 638
Net interest income (expense) after provision for loan and lease losses 2,035 2,327 1,873
NONINTEREST INCOME
Trust and investment services income 421 434 444
Service charges on deposit accounts 287 281 301
Operating lease income 75 122 173
Letter of credit and loan fees 221 213 194
Corporate-owned life insurance income 122 121 137
Net securities gains (losses)(b) — 1 14
Electronic banking fees 72 114 117
Gains on leased equipment 111 25 20
Insurance income 50 53 64
Net gains (losses) from loan sales 150 75 76
Net gains (losses) from principal investing 72 78 66
Investment banking and capital markets income (loss) 165 134 145
Other income 221 157 203
Total noninterest income 1,967 1,808 1,954
NONINTEREST EXPENSE
Personnel 1,618 1,520 1,471
Net occupancy 260 258 270
Operating lease expense 57 94 142
Computer processing 166 166 185
Business services and professional fees 193 186 176
FDIC assessment 31 52 124
OREO expense, net 15 13 68
Equipment 107 103 100
Marketing 68 60 72
Provision (credit) for losses on lending-related commitments (16)(28)(48)
Intangible asset amortization on credit cards 14 — —
Other intangible asset amortization 9 4 14
Other expense 385 362 460
Total noninterest expense 2,907 2,790 3,034
INCOME (LOSS) FROM CONTINUING OPERATIONS BEFORE INCOME TAXES 1,095 1,345 793
Income taxes 239 369 186
INCOME (LOSS) FROM CONTINUING OPERATIONS 856 976 607
Income (loss) from discontinued operations, net of taxes of $6, ($26) and ($14) (see Note 13) 9 (44)(23)
NET INCOME (LOSS) 865 932 584
Less: Net income (loss) attributable to noncontrolling interests 7 12 30
NET INCOME (LOSS) ATTRIBUTABLE TO KEY $858 $ 920 $ 554
Income (loss) from continuing operations attributable to Key common shareholders $ 827 $ 857 $ 413
Net income (loss) attributable to Key common shareholders 836 813 390
Per common share:
Income (loss) from continuing operations attributable to Key common shareholders $ .88 $ .92 $ .47
Income (loss) from discontinued operations, net of taxes .01 (.05) (.03)
Net income (loss) attributable to Key common shareholders(c) .89 .87 .45
Per common share — assuming dilution:
Income (loss) from continuing operations attributable to Key common shareholders $ .88 $ .92 $ .47
Income (loss) from discontinued operations, net of taxes .01 (.05) (.03)
Net income (loss) attributable to Key common shareholders(c) .89 .87 .44
Cash dividends declared per common share $.18 $ .10 $ .04
Weighted-average common shares outstanding (000)(d) 938,941 931,934 874,748
Weighted-average common shares and potential common shares outstanding (000) 943,259 935,801 878,153
(a) See Notes to Consolidated Financial Statements in 2012 Annual Report on Form 10-K.
(b) For 2012, 2011, and 2010, we did not have any impairment losses related to securities.
(c) EPS may not foot due to rounding.
(d) Assumes conversion of stock options and/or Preferred Series A, as applicable.