KeyBank 2010 Annual Report Download - page 4
Download and view the complete annual report
Please find page 4 of the 2010 KeyBank annual report below. You can navigate through the pages in the report by either clicking on the pages listed below, or by using the keyword search tool below to find specific information within the annual report.-
 1
1 -
 2
2 -
 3
3 -
 4
4 -
 5
5 -
 6
6 -
 7
7 -
 8
8 -
 9
9 -
 10
10 -
 11
11 -
 12
12 -
 13
13 -
 14
14 -
 15
15 -
16
-
17
-
18
-
19
-
20
-
21
-
22
-
23
-
24
 |
 |

2
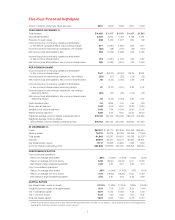
(a) Certain financial data for periods prior to 2007 have not been adjusted to reflect the effect of our January 1, 2008, adoption of new accounting guidance
regarding the offsetting of amounts related to certain contracts.
Five-Year Financial Highlights
dollars in millions, except per share amounts 2010 2009 2008 2007 2006
YEAR ENDED DECEMBER 31,
Total revenue $ 4,465 $ 4,415 $4,163 $4,927 $4,860
Noninterest expense 3,034 3,554 3,476 3,158 3,061
Provision for loan losses 638 3,159 1,537 525 148
Income (loss) from continuing operations attributable
to Key before cumulative effect of accounting change 577 (1,287) (1,295) 935 1,177
Income (loss) from discontinued operations, net of taxes (23) (48) (173) (16) (127)
Net income (loss) attributable to Key 554 (1,335) (1,468) 919 1,055
Income (loss) from continuing operations attributable
to Key common shareholders 413 (1,581) (1,337) 935 1,182
Net income (loss) attributable to Key common shareholders 390 (1,629) (1,510) 919 1,055
PER COMMON SHARE
Income (loss) from continuing operations attributable
to Key common shareholders $.47 $(2.27) $(2.97) $2.39 $2.91
Income (loss) from discontinued operations, net of taxes (.03) (.07) (.38) (.04) (.31)
Net income (loss) attributable to Key common shareholders .45 (
2.34) (3.36) 2.35 2.61
Income (loss) from continuing operations attributable
to Key common shareholders–assuming dilution .47 (2.27) (2.97) 2.36 2.87
Income (loss) from discontinued operations, net of taxes
–assuming dilution (.03) (.07) (.38) (.04) (.31)
Net income (loss) attributable to Key common shareholders
–assuming dilution .44 (2.34) (3.36) 2.32 2.57
Cash dividends paid .04 .0925 1.00 1.46 1.38
Book value at year-end 9.52 9.04 1
4.97 1
9.92 1
9.30
Tangible book value at year-end 8.45 7.94 12.48 16.47 16.07
Market price at year-end 8.85 5.55 8.52 23.45 38.03
Weighted-average common shares outstanding (000) 874,748 697,155 450,039 392,013 404,490
Weighted-average common shares
and potential common shares outstanding (000) 878,153 697,155 450,039 395,823 410,222
AT DECEMBER 31,
Loans $50,107 $ 58,770 $72,835 $70,492 $65,480
Earning assets 76,211 80,318 89,759 82,865 77,146(a)
Total assets 91,843 93,287 104,531 98,228 92,337(a)
Deposits 60,610 65,571 65,127 62,934 58,901
Key shareholders’ equity 11,117 10,663 10,480 7,746 7,703
Common shares outstanding (000) 880,608 878,535 495,002 388,793 399,153
PERFORMANCE RATIOS
From continuing operations:
Return on average total assets .66% (1.35)% (1.29)% 1.02% 1.34%
Return on average common equity 5.06 (19.00) (16.22) 12.11 15.28
Net interest margin (taxable equivalent) 3.26 2.83 2.15 3.50 3.73
From consolidated operations:
Return on average total assets .59% (1.34)% (1.41)% .97% 1.12%
Return on average common equity 4.78 (19.62) (18.32) 11.90 13.64
Net interest margin (taxable equivalent) 3.16 2.81 2.16 3.46 3.69
CAPITAL RATIOS
Key shareholders’ equity to assets 12.10% 11.43% 10.03% 7.89% 8.34%(a)
Tangible common equity to tangible assets 8.19 7.5 6 5. 9 8 6. 61 7.0 4 (a)
Tier 1 risk-based capital 15.16 12.75 10.92 7.44 8.24
Tier 1 common equity 9.34 7.5 0 5 .6 2 5.74 6.47
Total risk-based capital 19.12 16.95 14.82 11.38 12.43