Johnson and Johnson 2013 Annual Report Download - page 14
Download and view the complete annual report
Please find page 14 of the 2013 Johnson and Johnson annual report below. You can navigate through the pages in the report by either clicking on the pages listed below, or by using the keyword search tool below to find specific information within the annual report.-
 1
1 -
2
-
3
-
 4
4 -
 5
5 -
 6
6 -
 7
7 -
 8
8 -
 9
9 -
 10
10 -
 11
11 -
 12
12 -
 13
13 -
 14
14 -
 15
15 -
 16
16 -
 17
17 -
 18
18 -
 19
19 -
 20
20 -
 21
21 -
 22
22 -
 23
23 -
 24
24 -
25
-
26
-
27
-
28
-
29
-
30
-
31
-
32
-
33
-
34
-
35
-
36
-
37
-
38
-
39
-
40
-
41
-
42
-
43
-
44
-
45
-
46
-
47
-
48
-
49
-
50
-
51
-
52
-
53
-
54
-
55
-
56
-
57
-
58
-
59
-
60
-
61
-
62
-
63
-
64
-
65
-
66
-
67
-
68
-
69
-
70
-
71
-
72
-
73
-
74
-
75
-
76
-
77
-
78
-
79
-
80
-
81
-
82
-
83
-
84
 |
 |

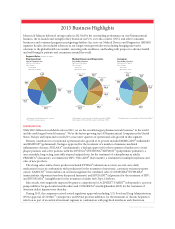
Analysis of Sales by Business Segments
Consumer Segment
Consumer segment sales in 2013 were $14.7 billion, an increase of 1.7% from 2012, which included 2.8% operational
growth and a negative currency impact of 1.1%. U.S. Consumer segment sales were $5.2 billion, an increase of 2.3%.
International sales were $9.5 billion, an increase of 1.4%, which included 3.1% operational growth and a negative
currency impact of 1.7%.
Major Consumer Franchise Sales:*
% Change
(Dollars in Millions) 2013 2012 2011 ’13 vs. ’12 ’12 vs. ’11
OTC $4,028 3,766 3,740 7.0% 0.7
Skin Care 3,704 3,618 3,715 2.4 (2.6)
Baby Care 2,295 2,254 2,340 1.8 (3.7)
Oral Care 1,622 1,624 1,624 (0.1) 0.0
Women’s Health 1,568 1,625 1,792 (3.5) (9.3)
Wound Care/Other 1,480 1,560 1,672 (5.1) (6.7)
Total Consumer Sales $14,697 14,447 14,883 1.7% (2.9)
* Prior year amounts have been reclassified to conform to current year presentation. Nutritionals, previously included in OTC, is included
in Wound Care/Other.
The Over-the-Counter (OTC) franchise achieved sales of $4.0 billion, an increase of 7.0% from 2012. Strong U.S. sales
growth of 19.7% was driven by analgesics and upper respiratory products, primarily due to continued progress in
returning a reliable supply of products to the marketplace.
McNEIL-PPC, Inc. continues to operate under a consent decree, signed in 2011 with the U.S. Food and Drug
Administration (FDA), which governs certain McNeil Consumer Healthcare manufacturing operations. McNeil continues to
operate the manufacturing facilities in Las Piedras, Puerto Rico and Lancaster, Pennsylvania and has made significant
progress; having met the remediation commitments at those facilities. The Company also successfully reintroduced many
products previously made in Fort Washington, Pennsylvania, from other sites. Plants operating under the consent decree
will continue to produce a simplified portfolio focused on key brands. The Fort Washington manufacturing site is not in
operation at this time and the Company recently made the decision to make further investments in that facility prior to
certification.
The Skin Care franchise achieved sales of $3.7 billion, an increase of 2.4% as compared to the prior year, primarily due to
strong results from the NEUTROGENA®, AVEENO®and Dabao product lines. The Baby Care franchise sales grew to
$2.3 billion, an increase of 1.8% from 2012. Growth was primarily due to sales of haircare and baby cleansers outside the
U.S. and newly acquired products from the acquisition of Shanghai Elsker Mother & Baby Co., Ltd. The Oral Care
franchise sales were flat as compared to the prior year. Increased sales of LISTERINE®outside the U.S. were partially
offset by the impact of the divestiture of the manual toothbrush product line in the U.S. The Women’s Health franchise
sales were $1.6 billion, a decrease of 3.5% primarily due to the divestiture of women’s sanitary protection products in the
U.S., Canada and Caribbean. The Wound Care/Other franchise sales were $1.5 billion in 2013, a decrease of 5.1% from
2012 due to competitive pressures and the impact of divestitures.
Consumer segment sales in 2012 were $14.4 billion, a decrease of 2.9% from 2011, which included 0.5% operational
growth offset by a negative currency impact of 3.4%. U.S. Consumer segment sales were $5.0 billion, a decrease of
2.0%. International sales were $9.4 billion, a decrease of 3.4%, which included 1.9% operational growth offset by a
negative currency impact of 5.3%.
4•Johnson & Johnson 2013 Annual Report