John Deere 2011 Annual Report Download - page 13
Download and view the complete annual report
Please find page 13 of the 2011 John Deere annual report below. You can navigate through the pages in the report by either clicking on the pages listed below, or by using the keyword search tool below to find specific information within the annual report.-
 1
1 -
2
-
 3
3 -
 4
4 -
 5
5 -
 6
6 -
 7
7 -
 8
8 -
 9
9 -
 10
10 -
 11
11 -
 12
12 -
 13
13 -
 14
14 -
 15
15 -
 16
16 -
 17
17 -
 18
18 -
 19
19 -
 20
20 -
 21
21 -
 22
22 -
 23
23 -
24
-
25
-
26
-
27
-
28
-
29
-
30
-
31
-
32
-
33
-
34
-
35
-
36
-
37
-
38
-
39
-
40
-
41
-
42
-
43
-
44
-
45
-
46
-
47
-
48
-
49
-
50
-
51
-
52
-
53
-
54
-
55
-
56
-
57
-
58
-
59
-
60
 |
 |

energy business (see Note 4). Research and development
expenses increased primarily as a result of increased spending in
support of new products and Interim and Final Tier 4 emission
requirements. Selling, administrative and general expenses
increased primarily due to growth and higher sales commissions.
Interest expense decreased due to lower average borrowing rates,
partially offset by higher average borrowings. Other operating
expenses decreased primarily due to lower depreciation
expenses this year due to the sale of the wind energy business
and the write-down of the related assets held for sale at the end
of last year, partially offset by higher crop insurance claims and
expenses this year. The effective tax rate for the provision for
income taxes was lower this year primarily due to the effect
of the tax expense related to the enactment of health care
legislation in 2010 (see Note 8).
The company has several defined benefit pension plans
and defined benefit health care and life insurance plans.
The company’s postretirement benefit costs for these plans in
2011 were $603 million, compared with $658 million in 2010.
The long-term expected return on plan assets, which is
reflected in these costs, was an expected gain of 8.0 percent
in 2011 and 8.2 percent in 2010, or $906 million in 2011
and $883 million in 2010. The actual return was a gain of
$695 million in 2011 and $1,273 million in 2010. In 2012,
the expected return will be approximately 8.0 percent.
The company expects postretirement benefit costs in 2012 to
be approximately the same as 2011. The company makes any
required contributions to the plan assets under applicable
regulations and voluntary contributions from time to time based
on the company’s liquidity and ability to make tax-deductible
contributions. Total company contributions to the plans were
$122 million in 2011 and $836 million in 2010, which include
direct benefit payments for unfunded plans. These contributions
also included voluntary contributions to plan assets of $650
million in 2010. Total company contributions in 2012 are
expected to be approximately $466 million, which include
direct benefit payments. The company has no required
significant contributions to pension plan assets in 2012 under
applicable funding regulations. See the following discussion of
“Critical Accounting Policies” for more information about
postretirement benefit obligations.
BUSINESS SEGMENT AND GEOGRAPHIC AREA RESULTS
The following discussion relates to operating results by
reportable segment and geographic area. Operating profit is
income before certain external interest expense, certain foreign
exchange gains or losses, income taxes and corporate expenses.
However, operating profit of the financial services segment
includes the effect of interest expense and foreign currency
exchange gains or losses.
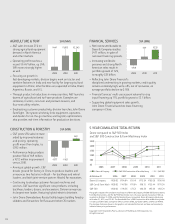
Worldwide Agriculture and Turf Operations
The agriculture and turf segment had an operating profit of
$3,447 million in 2011, compared with $2,790 million in 2010.
Net sales increased 21 percent this year primarily due to higher
shipment volumes. Sales also increased due to improved price
realization and foreign currency translation. The increase in
operating profit was largely due to increased shipment volumes
and improved price realization, partially offset by increased raw
material costs, higher manufacturing overhead costs related to
new products, higher selling, administrative and general
expenses and increased research and development expenses.
Worldwide Construction and Forestry Operations
The construction and forestry segment had an operating profit
of $392 million in 2011, compared with $119 million in 2010.
Net sales increased 45 percent for the year primarily due to
higher shipment volumes. Sales also increased due to improved
price realization. The operating profit improvement in 2011
was primarily due to higher shipment and production volumes
and improved price realization, partially offset by increased raw
material costs, higher selling, administrative and general
expenses and increased research and development expenses.
Worldwide Financial Services Operations
The operating profit of the financial services segment was
$725 million in 2011, compared with $499 million in 2010.
The increase in operating profit was primarily due to growth
in the credit portfolio and a lower provision for credit losses,
partially offset by narrower financing spreads. Last year’s results
were also affected by the write-down of wind energy assets that
were held for sale (see Note 4). Total revenues of the financial
services operations, including intercompany revenues, increased
3 percent in 2011, primarily reflecting the larger portfolio. The
average balance of receivables and leases financed was 13
percent higher in 2011, compared with 2010. Interest expense
decreased 7 percent in 2011 as a result of lower average
borrowing rates, partially offset by higher average borrowings.
The financial services operations’ ratio of earnings to fixed
charges was 2.22 to 1 in 2011, compared with 1.77 to 1 in 2010.
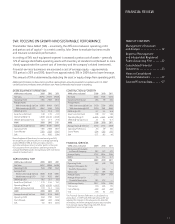
Equipment Operations in U.S. and Canada
The equipment operations in the U.S. and Canada had an
operating profit of $2,898 million in 2011, compared with
$2,302 million in 2010. The increase was due to higher
shipment volumes and improved price realization, partially
offset by increased raw material costs, higher manufacturing
overhead costs related to new products, increased selling,
administrative and general expenses and higher research and
development expenses. Net sales increased 17 percent primarily
due to higher shipment volumes and improved price realization.
The physical volume of sales increased 12 percent, compared
with 2010.
Equipment Operations outside U.S. and Canada
The equipment operations outside the U.S. and Canada had
an operating profit of $941 million in 2011, compared with
$607 million in 2010. The increase was primarily due to the
effects of higher shipment volumes and improved price
realization, partially offset by higher raw material costs, higher
manufacturing overhead costs related to new products,
increased selling, administrative and general expenses and higher
research and development costs. Net sales were 38 percent
higher primarily reflecting increased volumes and the effect of
foreign currency translation. The physical volume of sales
increased 30 percent, compared with 2010.
13